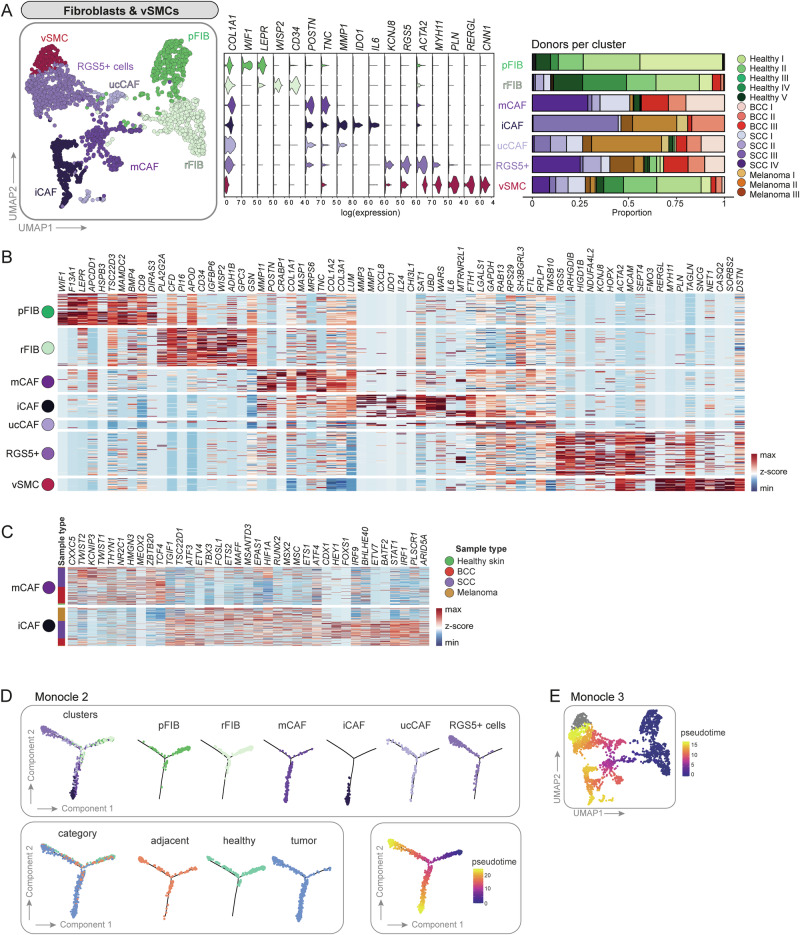
Fig. 3. Second-level clustering of fibroblasts and vascular smooth muscle cells (vSMCs) results in two heathy fibroblasts populations, four CAF subsets and one vSMC cluster.
A UMAP of second-level clustered fibroblasts and vSMCs. Violin plots of signature genes and bar plots showing donor sample (n = 15 donors) distribution per cluster. B Heatmap of top ten differentially expressed genes per cluster. C Differentially expressed transcription factors between mCAFs and iCAFs. B, C Source data of all significantly differentially expressed genes and transcription factors including exact p values are provided in the Source Data file. D Trajectoy analysis using Monocle2. Cells were highlighted according to clusters, category or pseudotime. E UMAP colored in pseudotime showing trajectory results from Monocle3.

