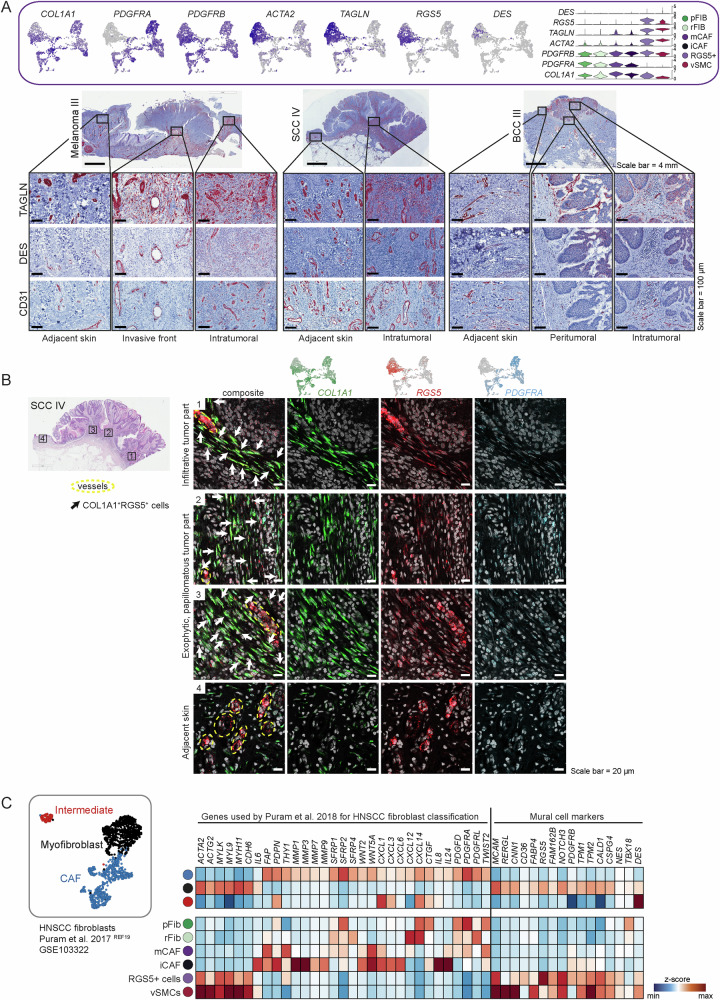
Fig. 4. The RGS5+ cells are an inhomogeneous population of CAFs and pericytes.
A Feature and violin plots showing the expression of fibroblast and pericyte marker genes in the RGS5+ cluster. Representative immunohistochemistry of TAGLN, DES and CD31 in different regions of the tumor (intratumoral, peritumoral) (n = 10 tumor samples from biologically independent donors). B Representative images of COL1A1 (green), RGS5 (red), and PDGFRA (blue) RNAScope fluorescence stainings in four different regions of FFPE tissue sections from donor sample SCC IV, representative for the n = 10 independent tumor samples. DAPI nuclear stain is shown in gray. Scale bar represents 20 μm. C Myofibroblasts in a HNSCC dataset from Puram et al.19 exhibit a very similar expression pattern in comparison to the RGS5+ cluster in our dataset.

