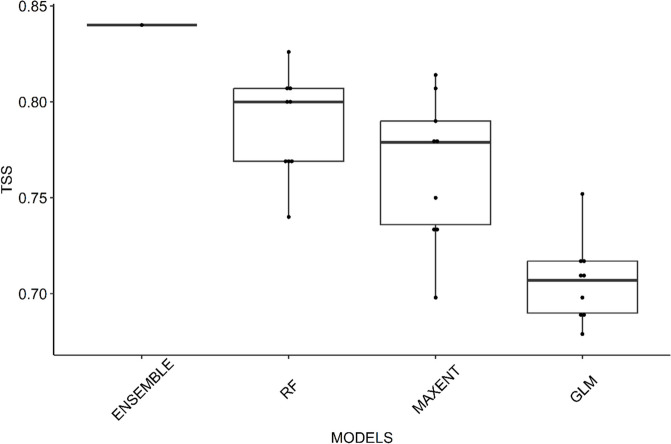
Fig. 2.
Boxplot representing the accuracy of the models used in BIOMOD2. The ensemble method yielded more accurate predictions than did the single-algorithm models: random forest (RF), maximum entropy (MAXENT), and the random generalized linear model (GLM). The upper box limit, midline, and lower box limit represent the lower quartile (Q1), the median, and the upper quartile (Q3), respectively. The whiskers represent the extension of the box to the minimum and maximum values that fall within 1.5 times the interquartile range, and any values outside this range are outliers, which are represented by red dots. TSS, true skill statistics

