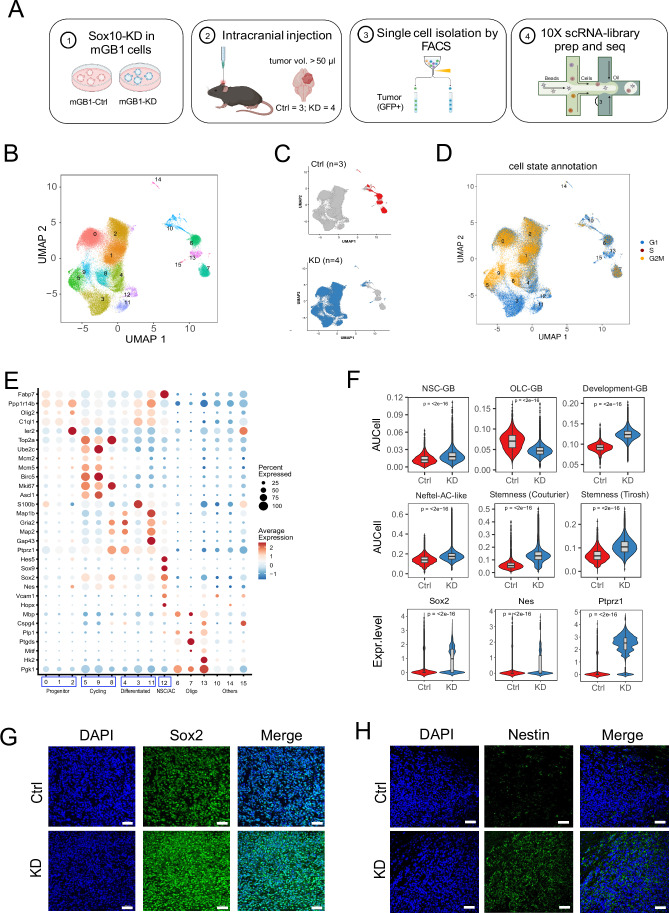
Figure 2. scRNA-seq analysis reveals divergent cell fates in control and Sox10-KD tumors.
(A) Sample preparation and single-cell sequencing workflow. (B) UMAP visualization of tumor cell transcriptional clusters. (C) UMAP visualization of tumor cell genotypes (top, control; bottom, Sox10-KD); red, control cells; blue, Sox10-KD cells. (D) UMAP visualization of tumor cell cell cycle phases (G1, blue; S, red; G2/M, yellow). (E) Dot plot summarizing the gene expression of the marker genes (Y axis) of each transcriptional cluster (X axis) shown in (B). The main clusters in Sox10-KD tumors are indicated by the boxes at the bottom. (F) Violin plots of AUCell scores for selected glioblastoma gene signatures in control and Sox10-KD tumor cells: Developmental-like, NSC and OLC-associated, stem cell. Violin plots showing the expression of representative NSC-related genes (Sox2, Nes, and Ptprz1). P values were calculated by unpaired two-tailed Wilcoxon’s rank-sum tests. n = 8336 and 57534 cells in control and KD tumors, respectively. The box-and-whisker plot shows the interquartile range (box), the median AUCell scores or normalized expression values (line inside the box), and the range of data within 1.5 times the interquartile range from the first and third quartiles (whiskers). P values were calculated using unpaired two-tailed Wilcoxon’s rank-sum tests. (G, H) Validation of the upregulation of Sox2 (G) and Nestin (H) in KD tumors. Scale bars = 50 µm. Source data are available online for this figure.

