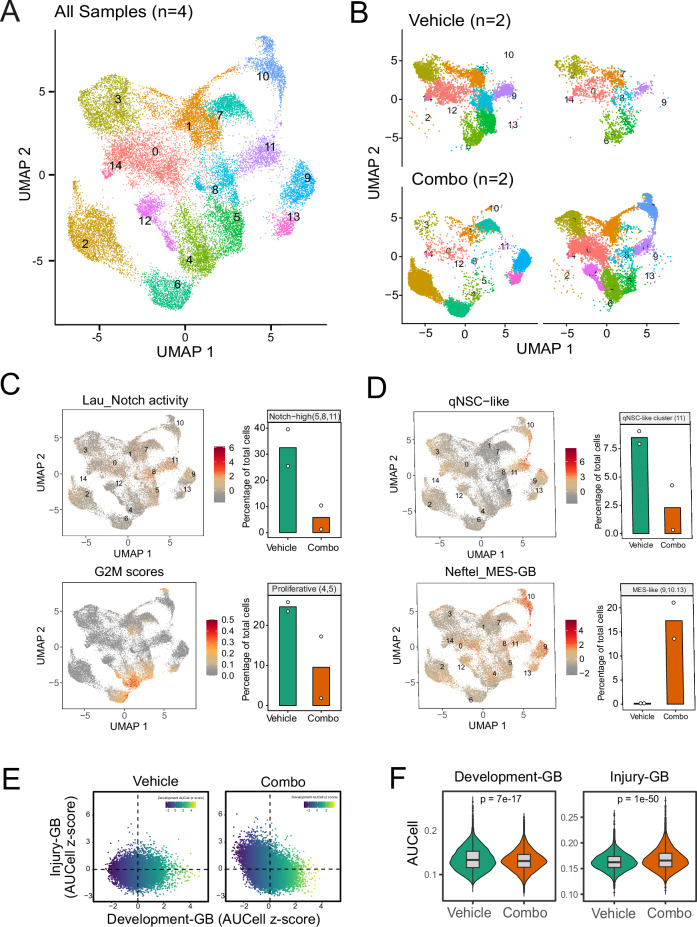
Figure 6. scRNA-seq analysis of post-treatment tumors.
(A) UMAP visualization of RNA expression clusters from single-cell sequencing analysis of tumors from two animals per treatment group (total n = 4). Tumors were harvested on day 5 after treatment started. (B) UMAP visualization of RNA expression clusters of the four individual tumors (n = 2 in each group). (C) UMAP plots showing the distribution of cells with high Notch (top) and G2M scores (bottom). Bar plots on the right quantify the depletion of clusters with the highest Notch activity (clusters 5, 8, 11) and proliferative scores (clusters 4 and 5) by combination relative to control treatment. The Y axis shows the proportion of cells in the indicated clusters relative to all cells sequenced for the respective tumor. Shown are the mean values ± interquartile ranges of the percentage of total cells in two animals in each group. (D) UMAP plots showing the distribution of cells with high qNSC-like (top) and MES-GB like scores (bottom). Bar plots on the right quantify the percentages of the cluster with high qNSC-like cell scores (cluster 11) and MES-GB scores (clusters 9, 10, and 13) by combination relative to control treatment. The Y axis shows the proportion of cells in the indicated clusters relative to all cells sequenced for the respective tumor. Shown are the mean values ± interquartile ranges of the percentage of total cells in two animals in each group. (E) Visualization of the dataset using scaled Developmental and Injury Response AUCell scores as X and Y axes, respectively. (F) Violin plot showing the AUCell scores of Development-GB and Injury-GB. n = 8160 and 17,334 cells in Vehicle and Combo groups, respectively. The box-and-whisker plot shows the interquartile range (box), the median AUCell scores (line inside the box), and the range of data within 1.5 times the interquartile range from the first and third quartiles (whiskers). P values were calculated using unpaired two-tailed Wilcoxon’s rank-sum tests.

