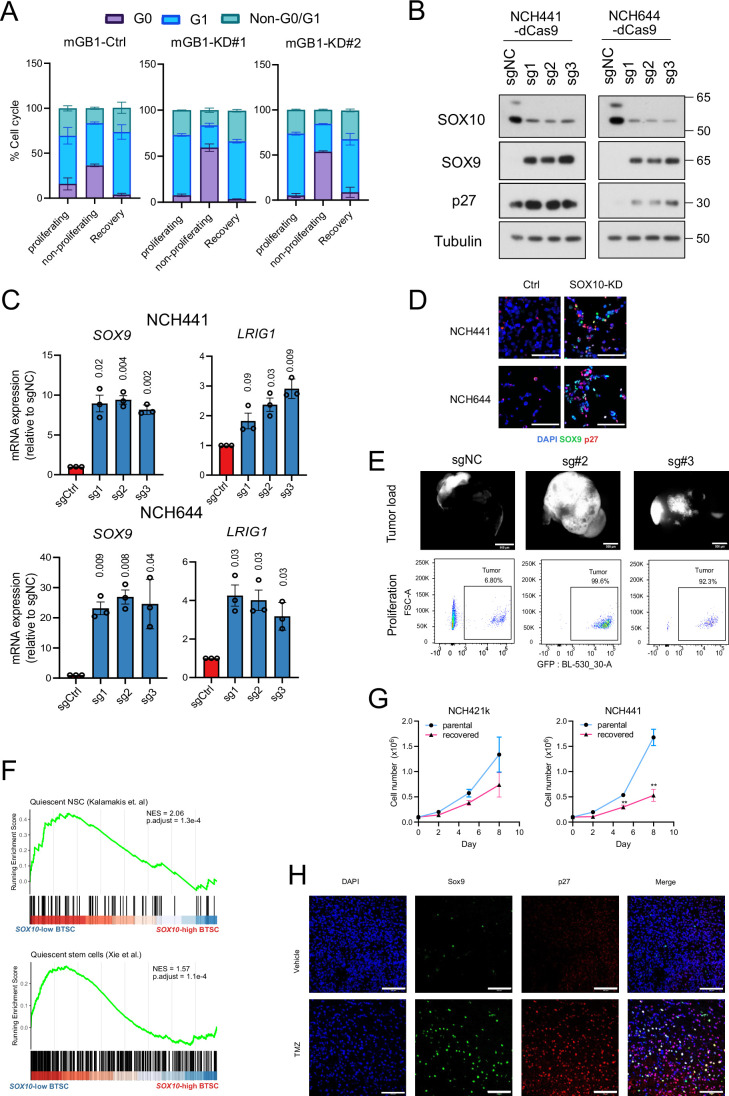
Figure EV3. SOX10 suppression induces quiescent stem cell features.
(A) Bar plots showing the distribution of mGB1 control and Sox10-KD cells in the G0, G1 and non-G0/G1 cell cycle phases. Error bars represent mean ± SEM from three independent experiments. (B) Western blot showing the upregulation of SOX9 and p27 in control cells (sgNC) and Sox10-KD cells (transduced with sg1-3) in SOX10-high NCH441 and NCH644 cells. The molecular weights (in KDa) of the detected proteins are indicated on the right. (C) RNA expression of the qNSC markers SOX9 and LRIG1. Mean values ± SEM relative to mGB1 control cells are shown; N = 3 biological replicates; P values were calculated with one-sample T test. (D) Immunofluorescence images of NCH441 and NCH644 control and SOX10-KD cells co-stained with SOX9 and p27. Scale bars = 100 µm. (E) GFP-tagged NCH644 control (sgNC) and SOX10-KD (sg#2 and sg#3) co-cultured with iPSC-derived cerebral organoids. Stereoscopic fluorescence images showing the growth on day 14 after co-culture. Scale bar = 500 µm. The scatter plots below show the quantification of the tumor load by GFP flow cytometry. (F) GSEA plots showing the enrichment of slow-cycling stem cell signatures in SOX10-low vs. SOX10-high BTSCs. Adjusted P values (P.adj) were calculated using the Benjamini–Hochberg method. (G) Growth curves of NCH421k and NCH441 parental cells and cells that have recovered after TMZ treatment. Mean values ± SEM from three experiments are shown. P values were calculated using a two-tailed unpaired t test. (H) Sox9 and p27 immunofluorescence staining of tumor sections from mice treated with DMSO or TMZ (100 mg/kg, for 5 consecutive days). Scale bars = 100 µm. Related to Fig. 3.

