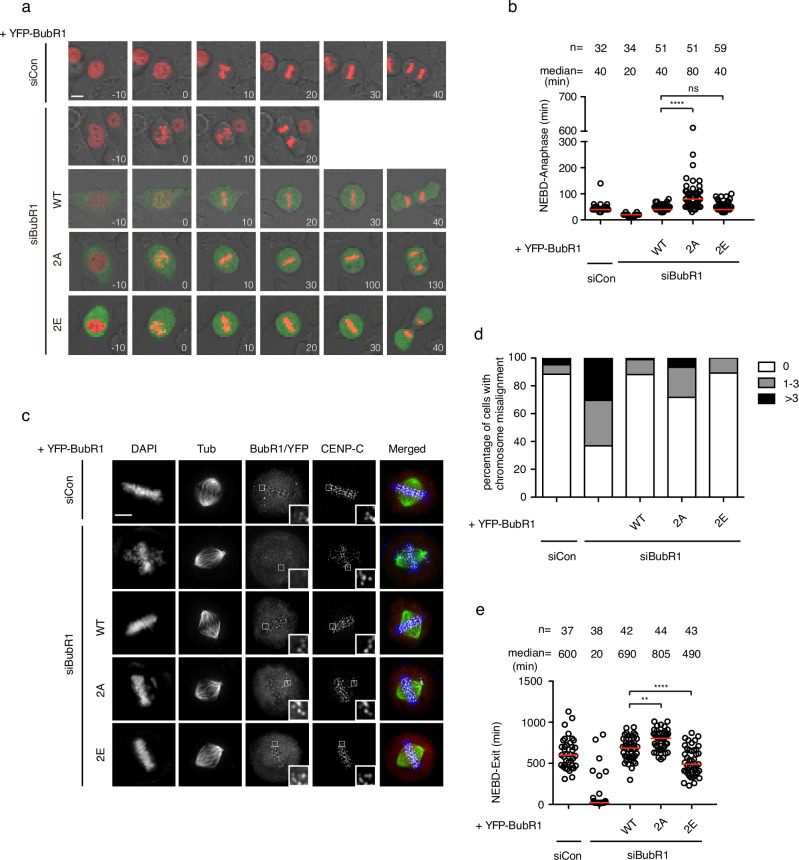
Fig. 1. Double phosphorylation of BubR1 T600/T608 is required for proper mitotic progression.
a Representative stills of live cell imaging of cells transfected with siRNA oligos against luciferase as control or with siRNA oligos against BubR1 with RNAi-resistant constructs expressing YFP-BubR1. mCherry-H3 construct was co-transfected for chromosome indication. Scale bar is 10 μm. b The mitotic timing of unperturbed mitosis recorded in (a). Each circle represents the time from NEBD to anaphase of a single cell. Red line indicates the median time. The number of cells analyzed per condition is indicated above (n = X). Mann–Whitney U-test was applied. ns means not significant; ****P < 0.0001. c Representative images of mitotic cells transfected with the same procedures as in (a). The cells were released from RO3306 into the medium with MG132 for 105 min before fixation and stained with corresponding antibodies. Scale bar is 10 µm. d Quantification of chromosome aligning defects from (c). 0 means all the chromosomes were aligned at the metaphase plate; 1–3 means there were 1 to 3 unaligned chromosomes outside of the metaphase plate. >3 means there were more than 3 chromosomes outside of the metaphase plate. More than 100 mitotic cells quantified in each condition. e Plot showing the time from NEBD to mitotic exit of the cells transfected with the same procedures as in (a) and (c). Low dose of nocodazole (100 ng/ml) was applied into the medium before live cell imaging conducted. Each circle represents the time spent in mitosis of a single cell. Red line indicates the median time. The number of cells analyzed per condition is indicated above (n = X). Mann–Whitney U-test was applied. **P < 0.01; ****P < 0.0001.

