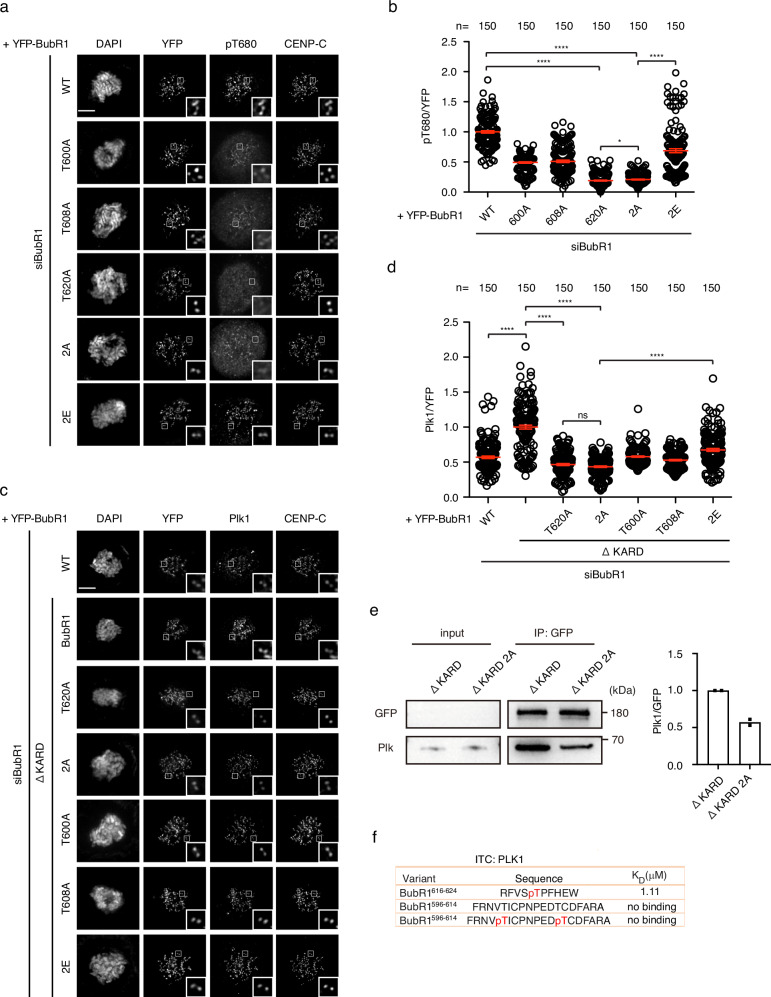
Fig. 2. Double phosphorylation of BubR1 T600/T608 promotes BubR1-B56 and BubR1-Plk1 interaction.
a Representative images of mitotic cells transfected with siRNA oligos against BubR1 and RNAi-resistant constructs expressing YFP-BubR1. The cells were released from RO3306 into the medium with nocodazole (200 ng/ml) for 45 min before fixation and staining with corresponding antibodies. Scale bar is 10 µm. b Quantification of of kinetochore signals of BubR1 pT680 against YFP-BubR1 from (a). The values of 150 kintochores from 10 cells for each condition were presented. The red line indicates the mean value which was set to 1 for wild type BubR1 sample (WT) and the rest was normalized to it. Bar is standard error of the mean. Mann–Whitney U-test was applied. *P < 0.1; ****P < 0.0001. c Similar treatment as (a). d Quantification of kinetochore signals of Plk1 against YFP-BubR1 from (c). The values of 150 kintochores from 10 cells for each condition were presented. The red line indicates the mean value which was set to 1 for BubR1 ΔKARD sample and the rest was normalized to it. Bar is standard error of the mean. Mann–Whitney U-test was applied. ns means not significant; ****P < 0.0001. e YFP-tagged BubR1 was expressed in HeLa cells and immunoprecipitated by GFP-trap beads. Plk1 were detected by western blot from the immunoprecipitate. Quantification of Plk1 intensity against YFP intensity was plotted on the right from two repeats. The column represents median value. The ratio from ΔKARD 2A was normalized against the ratio from ΔKARD which was set to 1. f ITC showing the binding between BubR1 peptides and recombinant Plk1.

