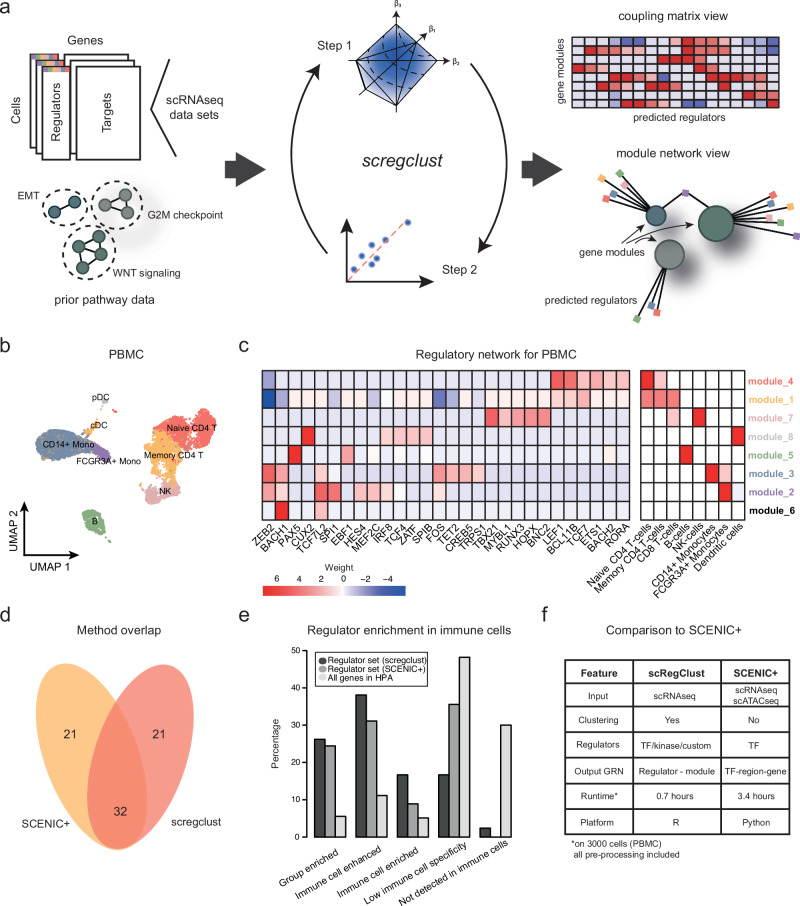
Fig. 1. A regulatory-driven clustering method.
a A schematic overview of the algorithm pipeline from gene expression data to regulatory networks. b UMAP embedding of the PBMC cells colored according to immune cell type assignment. Abbreviations: Mono monocytes, T T-cells, B B-cells, NK natural killer cells, pDC plasmacytoid dendritic cells, cDC classical dendritic cells. c The regulatory table inferred by scregclust. In the left panel, rows correspond to modules and columns to regulators (TFs). The scale in the heatmap goes from strong positive regulation (red) to strong negative regulation (blue), as indicated by the key. In the right panel, rows correspond to modules and columns to immune cell type gene signatures. Heatmap color indicates degree of overlap between module gene content and gene signatures, as quantified by Jaccard Index. Module name color (rows) correspond to colors in (b), indicating the most enriched immune cell type. Source data are provided as a Source Data file. d Venn diagram showing the overlap in identified regulators between SCENIC+ and scregclust. e Annotation of immune cell specificity of the identified regulators by scregclust and SCENIC+ according to the Human Protein Atlas (HPA)36. Immune enriched/enhanced indicate that a gene’s mRNA level is at least 4-fold higher in an immune cell type compared to all other tissues, as defined by the authors of the HPA. The regulator sets are contrasted to the average annotation of all genes in the HPA (n = 13157). f Comparison between scregclust and SCENIC+.

