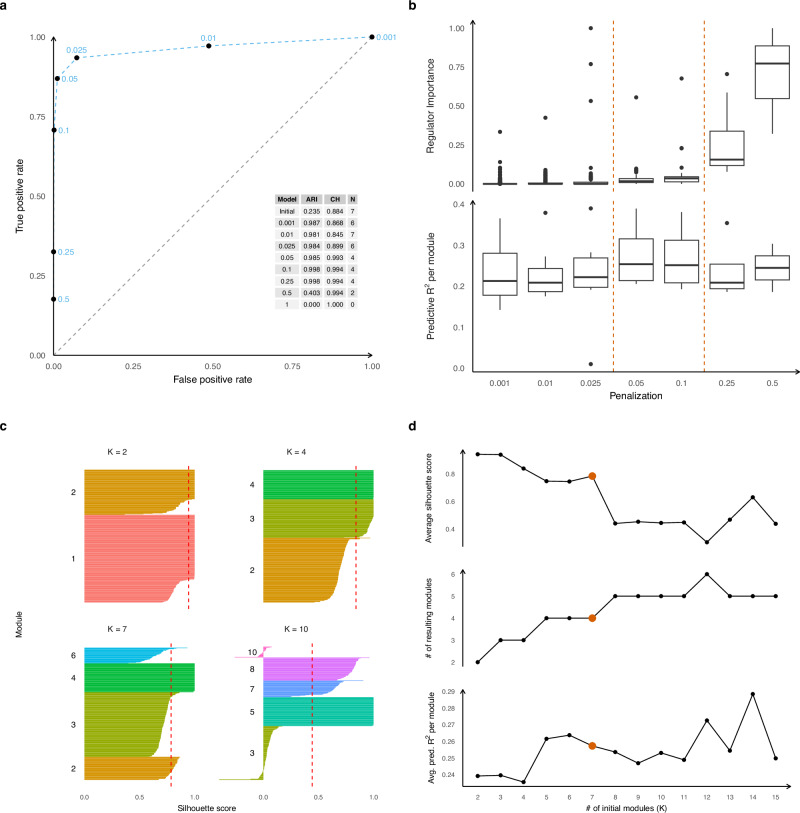
Fig. 2. Method tuning and analysis tools.
Results from scregclust run on simulated scRNAseq count data (see the Supplementary Material for details on data generation). a Average true positive rate (TPR) shown against average false positive rate (FPR) in a ROC curve (dashed blue line), illustrating the quality of groundtruth regulator identification. TPR and FPR are computed per target gene and then averaged (n = 268, 270, 271, 271, 271, 80 from smallest to largest penalization). The corresponding penalty parameter is shown with each average. A table of adjusted Rand indices (ARI) between the estimated clustering and the true clustering, the average cluster homogeneity (CH), and the resulting number of modules (N) is shown as an inset. b Boxplots of predictive R2 per non-empty module (n = 6, 7, 6, 4, 4, 4, 2, cfr. N in Part A) and importance per regulator associated with at least one non-empty module (n = 900, 453, 96, 39, 25, 11, 3) shown across a progression of seven penalty parameters. Dashed lines indicate a region of solutions that demonstrates our selection rule. Boxplots consist of center lines (median), box bounds (1st and 3rd quartile), and upper and lower whiskers. Upper whiskers are drawn from the upper box bound to the largest data point but no further than 1.5 times the inter-quartile range (IRQ), analogous for lower whiskers. All data points not covered by box and whiskers are shown as dots. c Silhouette scores for each module for runs different initial K. Dashed red lines indicate the average silhouette score. Target genes have been grouped by module and sorted by decreasing silhouette score. Colors and labels to the left of each group indicate the module. d Average silhoutte scores, resulting number of modules, and average predictive R2 as a function of the initial number of modules K. Optimal selection indicated by red points.

