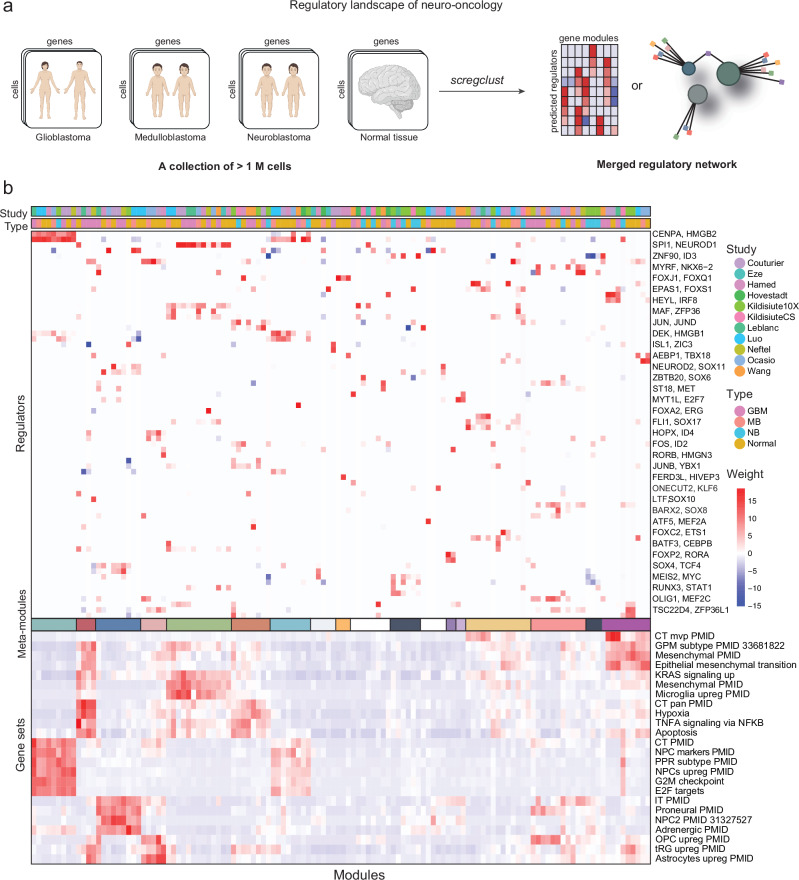
Fig. 4. The regulatory landscape of neuro-oncology.
a Schematic overview of the analysis. Created in BioRender. Nelander, S. (2023) BioRender.com/b96y619. b Middle panel is the regulatory table from scregclust, with modules as columns and regulators (TFs) as rows. Top panel are annotation bars indicating what type and study each module originate from. Meta-modules (Fig. 5) are indicated by color in the bar below the middle panel. For ease of reading, two regulator (gene) names are indicated per row, the gene name after the comma are for the row below. Bottom panel display similarity of each module (Jaccard index) to a database of neuro-oncology related gene sets, derived from studies indicated by PubMed ID (PMID). Abbreviations: CT cellular tumor, MVP microvascular proliferation, GPM glycolytic/plurimetabolic, pan pseudopalisading cells around necrosis, NPC neural progenitor cells, PPR proliferating progenitor cells, IT infiltrative tumor, OPC oligodendrocyte progenitor cells, tRG truncated radial glia. Source data are provided as a Source Data file.

