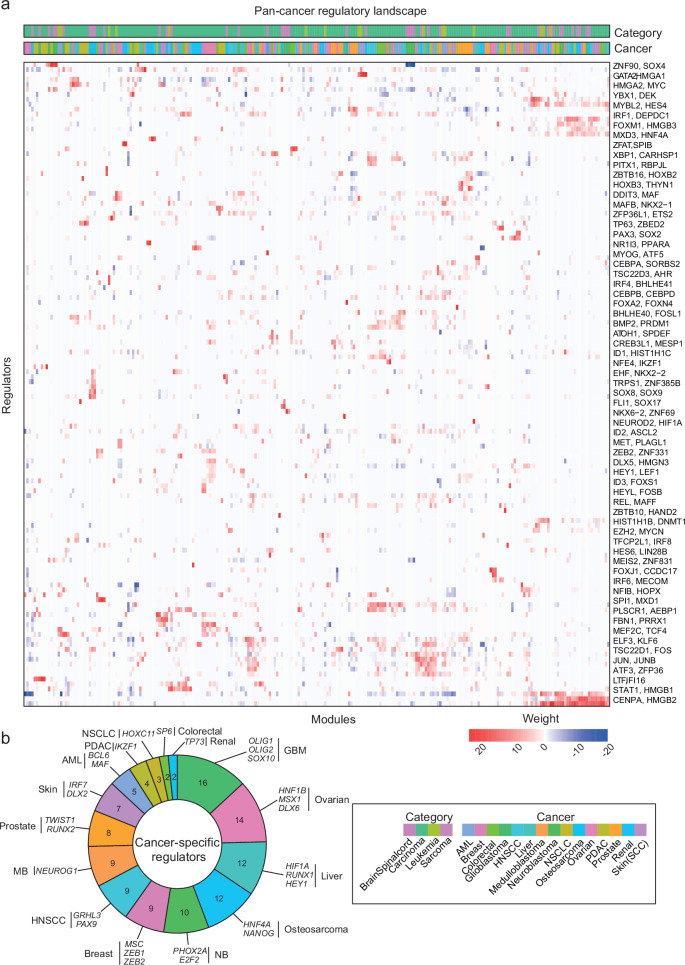
Fig. 6. The pan-cancer regulatory landscape.
a Merged regulatory table from scregclust, with modules as columns and regulators (TFs) as rows. Top panel are annotation bars indicating what cancer type and cancer category each module originate from. For ease of reading, two regulator (gene) names are indicated per row, the gene name after the comma are for the row below. Source data are provided as a Source Data file. b The number of cancer-specific regulators per cancer type, colored as in (a). A couple of specific regulators per cancer type are displayed. Glioblastoma had the most cancer-specific regulators (16), with OLIG1, OLIG2 and SOX10 being three examples.

