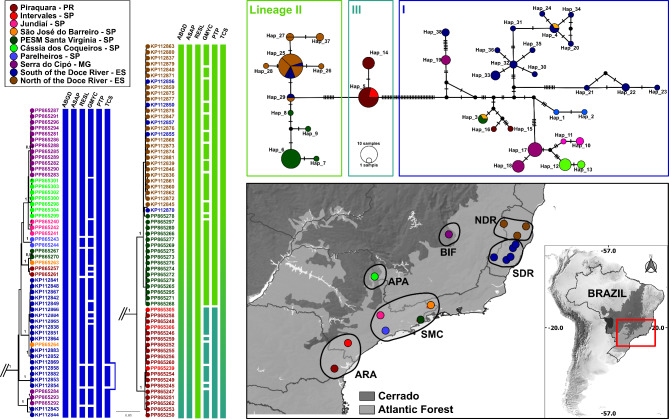
Fig. 1.
Phylogeographic analysis of Pintomyia monticola populations based on COI sequences in Brazil. Left: Bayesian maximum credibility (MCC) tree with terminal labels being GenBank accession numbers. The color pattern of tip shapes and labels corresponds to the sampling localities. Values near nodes are posterior probabilities > 0.95. Bars adjacent to terminals represent MOTU delimitation made by corresponding algorithms and are colored according to the intermediate scenario given by PTP. Top right: Median Joining Haplotype network. Bottom right: Map of sample localities. The different locations were grouped and highlighted according to the main geographical regions mentioned in the methods section: NDR North of the Doce River, SDR South of the Doce River, SMC Serra do Mar Coastal Forest, ARA Araucaria moist Forest, APA Alto Paraná Atlantic Forest, BIF Bahia Interior Forest.

