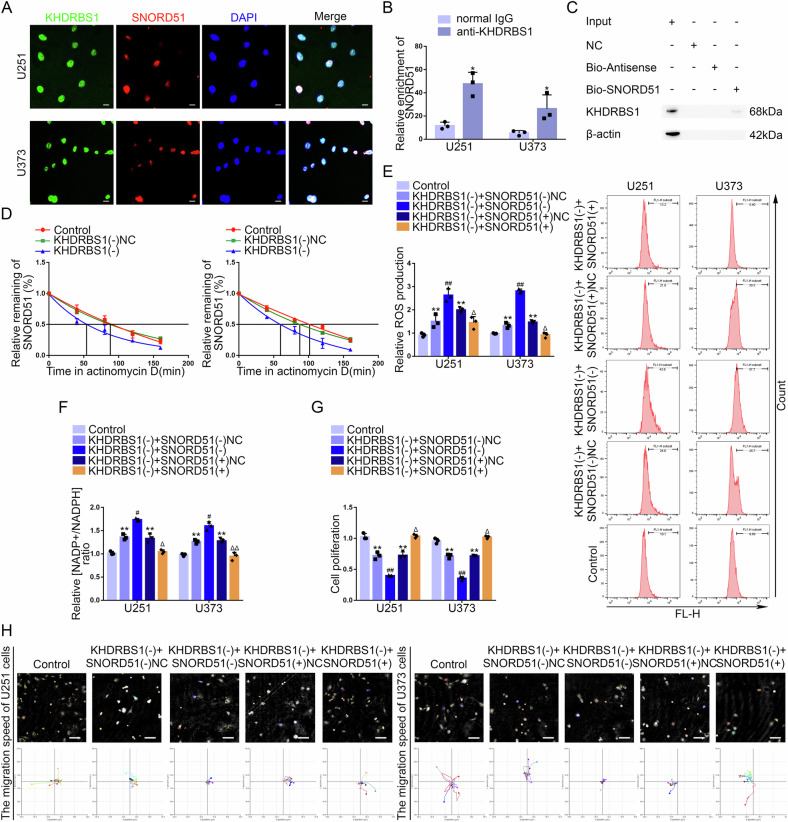
Fig. 3. KHDRBS1 enhanced the stability of SNORD51 by binding to SNORD51 promoting the PPP and biological behavior of GBM cells.
A The location of SNORD51 (red) and KHDRBS1 (green) in the cytoplasm and nuclear fractions (blue) of U251 and U373 cells was detected by IF and FISH. Nuclei were labeled with DAPI. Scale bars: 20 µm. B An enrichment of SNORD51 in KHDRBS1 immunoprecipitated samples via RNA immunoprecipitation (RIP) assay. Relative enrichment was measured by quantitative real-time PCR. Data are presented as the mean ± SD (n = 3, each group). *P < 0.05 versus normal IgG group. C RNA pull-down assay followed by western blot confirmed specific associations of KHDRBS1 with biotinylated-SNORD51. D The effect of KHDRBS1 knockdown on the half-life of SNORD51 was measured by RT-qPCR after actinomycin D treated in U251 and U373 cells. Data are presented as the mean ± SD (n = 3, each group). E, F The effect of SNORD51 on pentose phosphate pathway was analyzed by intracellular ROS level and relative ratio of NADP + /NADPH in U251 and U373 cells. Data are presented as the mean ± SD (n = 3, each group). **P < 0.01 versus Control group; #P < 0.05 versus KHDRBS1(−) + SNORD51(−)NC group; ##P < 0.01 versus KHDRBS1(−) + SNORD51(−)NC group; ΔP < 0.05 versus KHDRBS1(−) + SNORD51( + )NC group; ΔΔP < 0.01 versus KHDRBS1(−) + SNORD51( + )NC group. G The effect of KHDRBS1 and SNORD51 on cell proliferation of U251 and U373 cells was analyzed by CCK-8 assay. Data are presented as the mean ± SD (n = 3, each group). **P < 0.01 versus Control group; ##P < 0.01 versus KHDRBS1(−) + SNORD51(−)NC group; ΔP < 0.05 versus KHDRBS1(−) + SNORD51( + )NC group. H The combined effects of KHDRBS1 and SNORD51 on cell migration of U251 and U373 cells was analyzed by Hstudio M4 system. Scale bars: 100 µm.

