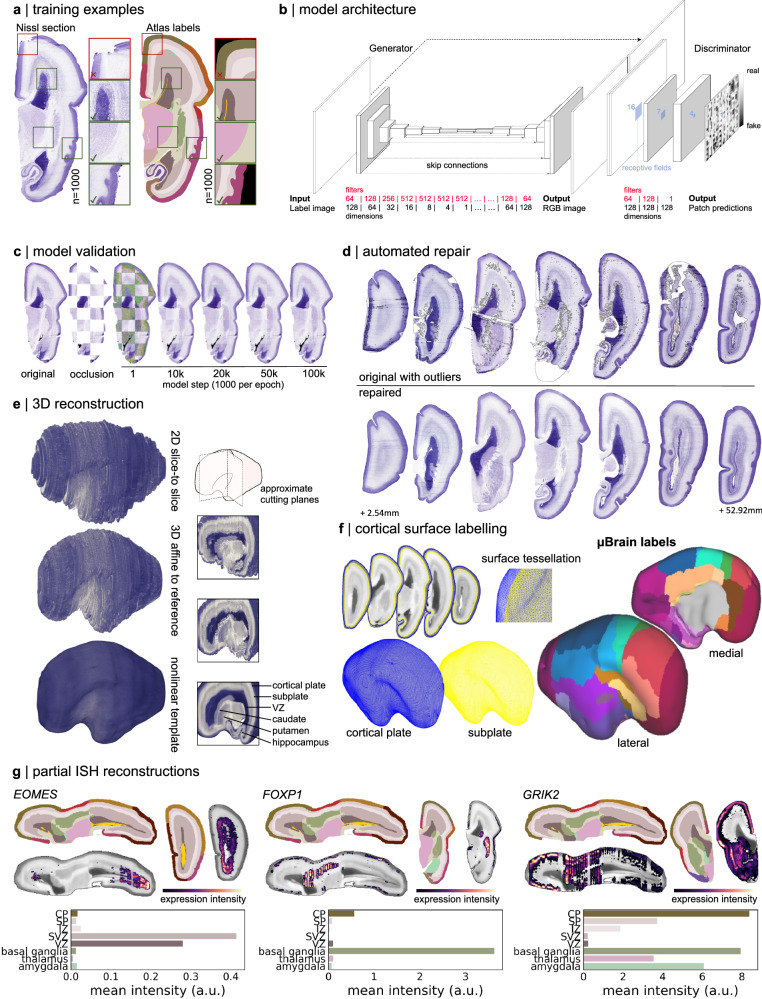
Fig. 1. Generation of a 3D anatomical atlas of the mid-gestation foetal brain.
a Paired histological sections and simplified anatomical annotations were divided into 256 256 random patches (n = 1000) for model training. Patches were quality-checked prior to selection to ensure good overlap between labels and anatomy and no tissue damage. b Pix2pix model architecture showing a U-Net generator coupled with a PatchGAN discriminator. Box sizes represent image width, height and number of filters/channels (depth) at each layer. The filters and dimensions of each layer are shown below. c Model performance was evaluated on a set of sections that were not included in the training dataset. Checkerboard occlusions are shown with the original section, occluded patch predictions are shown using the trained model after a given number of iterations. d The trained model was used to replace RGB values of outlying pixels with synthetic estimates. Top row: original sections spaced throughout the cerebral hemisphere with automatically identified outlier pixels outlined in grey. Bottom row, repaired sections. e Repaired sections were aligned via linear, affine and iterative nonlinear registrations (see “Methods”) to create a 3D volume with a final isotropic resolution of 150 µm. Right: Cut-planes illustrate internal structures after each stage of reconstruction. The reconstructed tissue label volume is shown in Supplementary Fig. S4. VZ: ventricular zone. f The outer (pial) and inner (subplate) cortical plate boundaries were extracted as surface tessellations. The μBrain cortical labels were projected onto the surface vertices to form the final cortical atlas (see Supplementary Fig. S4). Cortical areas correspond to matched LMD microarray data (Supplementary Data S4 and Supplementary Fig. S4d). g Partial reconstructions of EOMES, FOXP1 and GRIK2 ISH data. ISH-stained sections were registered to the nearest Nissl-stained sections and aligned to the μBrain volume. Top row: selected axial and coronal sections of the μBrain volume and corresponding tissue labels with ISH expression of three developmental genes: EOMES, FOXP1 and GRIK2 overlaid. Expression intensity was derived from false-colour, semi-quantitative maps of gene expression. Bottom row: average expression intensity within each tissue or brain structure based on μBrain tissue labels. Averages were calculated only within sections where ISH was available for each gene. Source data are provided as a Source Data file.

