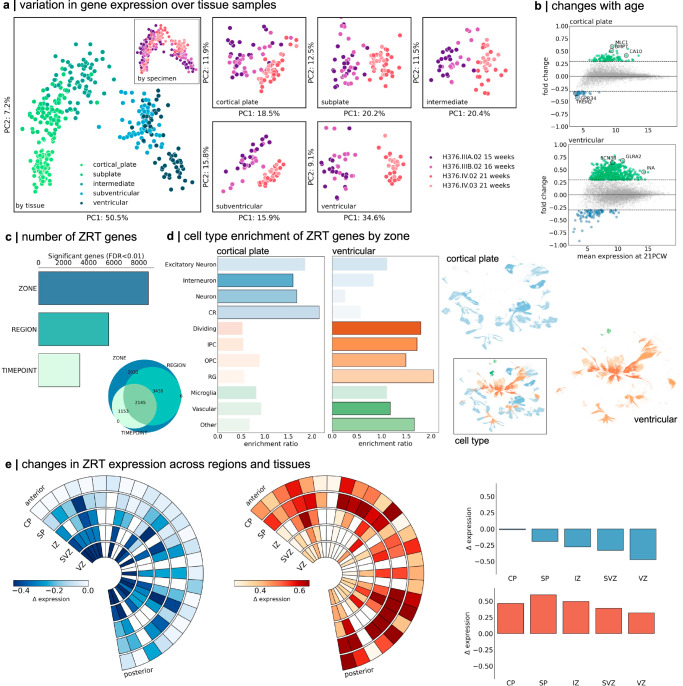
Fig. 2. Regional gene expression in the mid-gestation foetal brain.
a PCA of LMD microarray data (n = 8771 genes) in four prenatal brain specimens aged 15 PCW to 21 PCW. All tissue samples are shown (left) and coloured by tissue zones (main) and specimen (inset). PCA was applied to all samples in each tissue zone separately (right). Samples are coloured by specimen and clustered by age. PC: Principal component. b PC1 was associated with age-related change in all tissues and correlated between neighbouring zones. Plots show mean gene expression at 21 PCW (averaged over specimen and region) against fold change in gene expression between 15/16 PCW and 21 PCW for two tissue zones (cortical plate, top and ventricular zone, bottom). Genes with a log2(fold change) > 0.3 are shown in green (< − 0.3 in blue). Representative genes are highlighted. c Number of genes with differential expression over tissue zones (ZONE), cortical region (REGION) or timepoint (TIME). Venn diagram shows the overlap of gene sets. In total, n = 2145 were differentially expressed across zone, region and time (ZRT genes). d Foetal cell type enrichment10 of ZRT genes differentially expressed in the cortical plate and ventricular zones (left). Enrichments of other tissue zones are shown in Supplementary Fig. S10. Significant cell type enrichments in each zone are highlighted with black outline (one-sided hypergeometric test; p < 0.05 uncorr.). UMAP projection of cell types showing enriched clusters of OPCs and radial glia in the proliferative ventricular zone, and neuronal cell types in the cortical plate. Inset: UMAP projection coloured by cell type. CR: Cajal-Retzius cells; IPC: intermediate progenitor cells; OPC: oligodendrocyte progenitor cells; RG: radial glia. e ZRT gene expression over time and region. Wedge plots (left) show the pattern of expression of ZRT genes that decrease (left) or increase (right) between 15 and 21 PCW. Rows indicate tissue zones, and columns indicate cortical regions ordered from anterior to posterior poles. Boxes are coloured by changes in gene expression over time ( expression). Right: bar charts show mean change in gene expression for decreasing (top) and increasing (bottom) ZRT genes averaged within tissue zones. CP: cortical plate; SP: subplate; IZ: intermediate zone; SVZ: subventricular zone; VZ: ventricular zone. Source data are provided as a Source Data file.

