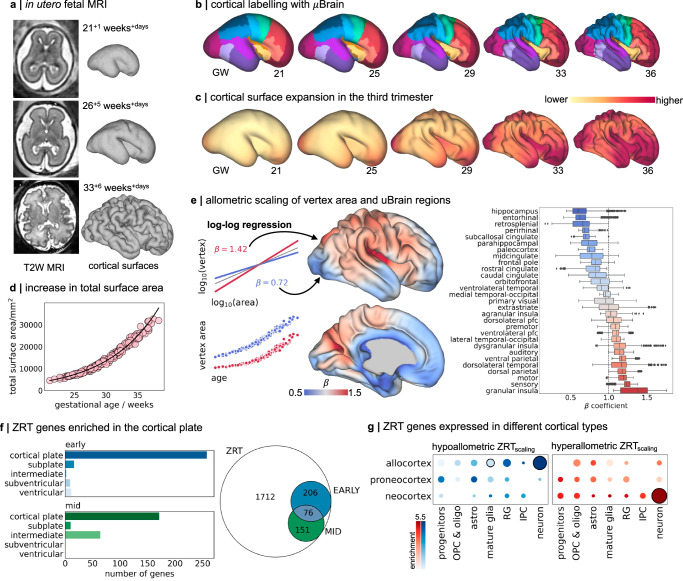
Fig. 3. Preferential cortical expansion during the third trimester.
a n = 195 foetal MRI scans were acquired during the third trimester of pregnancy. T2-weighted (T2W) scans were reconstructed using a motion-robust processing pipeline and used to generate tessellated cortical surface representations that were aligned to the dHCP foetal surface template b μBrain cortical labels projected onto dHCP foetal template surfaces from 21 to 36 weeks gestation using nonlinear surface registration. Surfaces are scaled to the same size for visualisation. c For each timepoint, weighted average vertex area maps are displayed on the respective surface templates. Foetal cortical area maps were calculated from individual, co-registered and resampled foetal surfaces using a Gaussian kernel (sigma = 1 week). d Total cortical surface area calculated across all surface vertices (excluding the midline) as a function of gestational age at scan. e Left: Models of allometric scaling were calculated for each vertex, modelling log10(vertex area) as a function of log10(total area) (top). In this framework, > 1 indicates hyperallometric growth (a relative expansion faster than the global rate). Note that a faster growth rate does not necessarily equate to greater total area at any given time (bottom). Middle: Hyperallometric scaling with respect to total cortical surface area () plotted on the 36w template surface representing preferential cortical expansion during development. Right: Distribution of scaling coefficients for all vertices in each μBrain label in (a), ordered by mean scaling. Boxplots show quartiles (box) and range (whiskers) of areal scaling for all vertices in each region, markers indicate outliers (> 1.5 interquartile range). f Right: In total, the expression of 433 ZRT genes was correlated with areal scaling in gestation. Left: Significant associations (Kendall’s , pFDR < 0.01) were observed across both early (15/16 PCW) and mid-gestation (21 PCW) time points and in all tissue zones. g Enrichment of hypoallometric (left) and hyperallometric (right) ZRTscaling genes in cortical-type specific cell markers10. Circle size denotes enrichment ratio, and significant associations (p < 0.05, one-sided hypergeometric test, uncorr.) are highlighted with black outline. OPC: oligodendrocyte precursors; Astro: astrocytes; RG: radial glia; IPC: intermediate progenitor cells. Source data are provided as a Source Data file.

