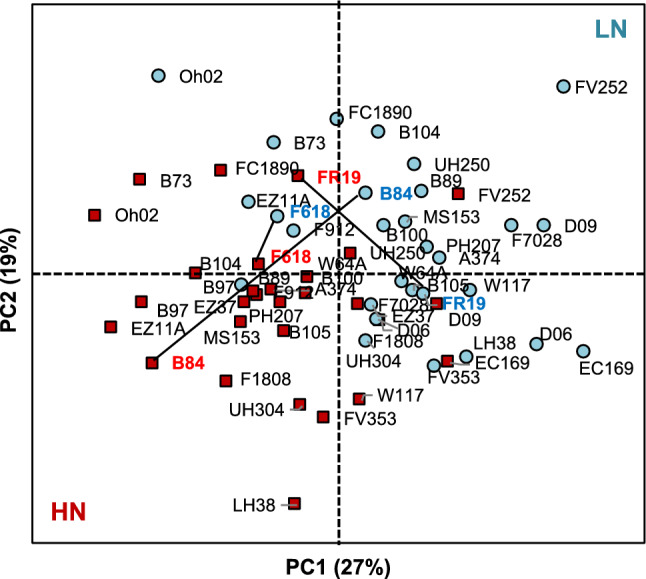
Fig. 2.

Ordination diagram of the PCA analysis for the 29 maize hybrids based on the different eco-physiological, developmental and yield-related traits. Traits were measured in the panel of 29 maize hybrids grown under reduced (LN) and non-limiting (HN) fertilization conditions. Diagrams are defined by the first two PCs of the PCA of the different variables using their LSmeans: PC1 (27% of variance explained) and PC2 (19% of variance explained). LN: reduced N fertilization (blue circles). HN: non-limiting N fertilization (red squares). Black lines between LN and HN represent the Euclidian distance between the three hybrids (B84, FR19 and F618) exhibiting the most contrasted difference with respect to their morphological and physiological responsiveness to N fertilization
