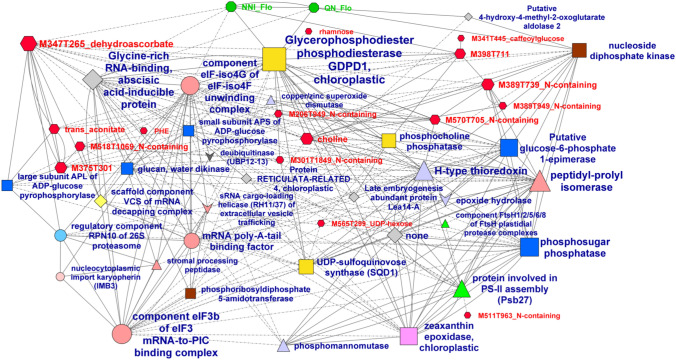
Fig. 4.
Correlation network between the variables contributing to separate the two N treatments selected based on the multiblock sparse PLS-DA presented in Fig. 3 and having an absolute loading value higher than 0.1 on LV1. Spearman correlations with an absolute value higher than 0.75 are shown in a network built with Cytoscape. Only the subnetwork comprising variables of the three datasets is shown. Node size is proportional to the number of connections. For edges, a solid line means a positive correlation and a dashed line means a negative correlation. Node symbols are represented by green octagons for eco-physiological, developmental and yield-related traits and red hexagons for metabolites. For proteins, different symbols and colors are used according to Mercator categories

