
FIGURE 3.
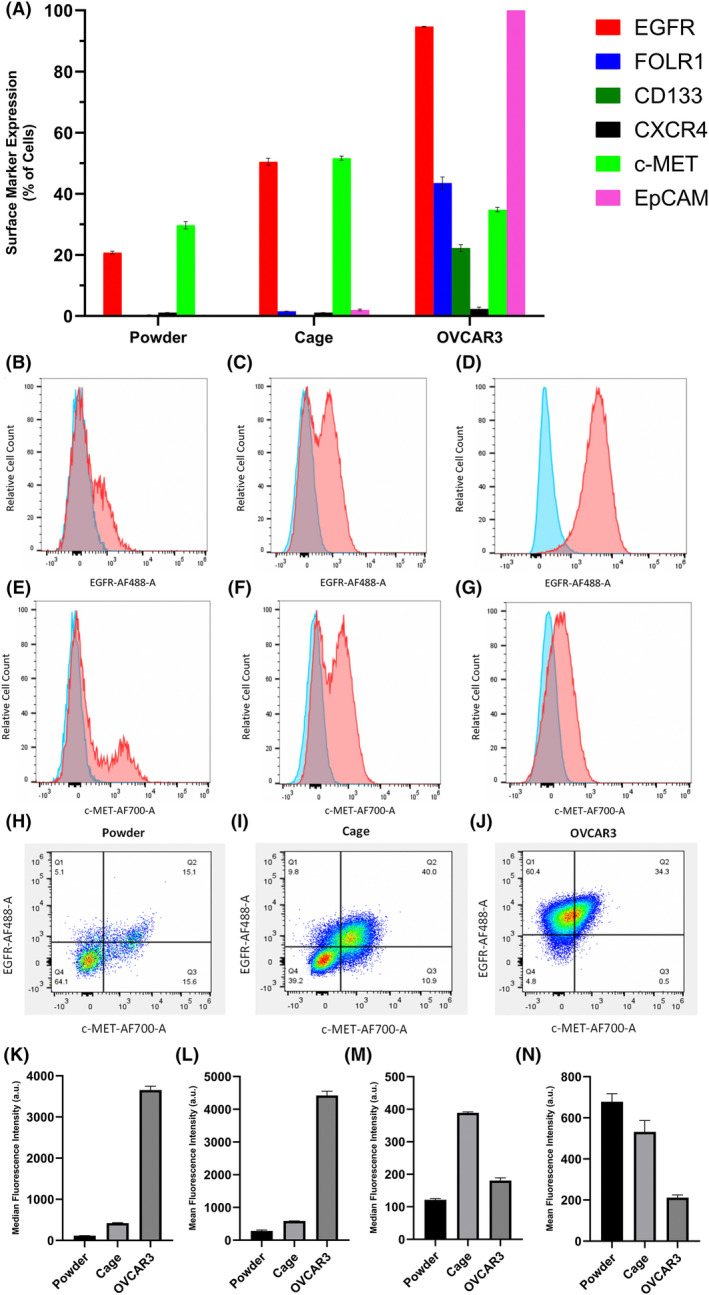
Flow cytometry showed intriguing distinctions between cell surface biomarker expressions of the patient‐derived primary HGSOC cell lines and the immortalized HGSOC cell line. (A) Percent positive cells for the cell membrane biomarkers. Representative fluorescence histograms showing EGFR, (B)–(D), and c‐MET, (E)–(G), expressions of Powder (left; (B) and (E)), Cage (middle; (C) and (F)), and OVCAR3 (right; (D) and (G)), cell lines. Blue and red histograms represent the fluorescence of unstained and stained cells, respectively. (H)–(J) Dot plots of EGFR–AF488 and c‐MET–AF700 fluorescence to assess the heterogeneity of cells. Cells in Q1 and Q3 are singly positive for EGFR and c‐MET, respectively. Cells in Q2 and Q4 are positive and negative for both markers, respectively. Relative EGFR ((K), median and (L), mean) and c‐MET (M), median and (N), mean) expression levels of Powder, Cage, and OVCAR3 cell lines. The fluorescence of unstained cells was subtracted from the fluorescence of stained cells before making comparisons. Staining was performed in triplicate. Results are mean ± standard deviation.