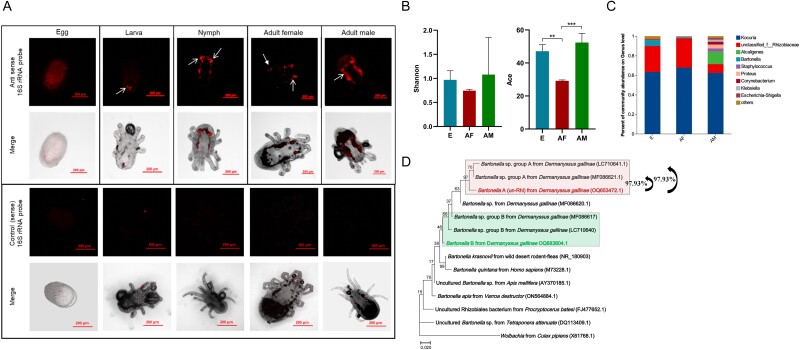
Figure 1.
Location and composition analysis D. gallinae bacterial microbiota across stages. (A) Localization of bacterial microbiota in D. gallinae. Fluorescence in situ hybridization analysis of the bacteria in D. gallinae at different developmental stages using the universal anti-sense 16S rRNA probe, and a sense probe served as a negative control. The merged image showing overlap of bacteria channel on bright field. The area indicated by the white arrow is the ceca of the mites. Different exposure times were used to obtain observable fluorescence intensity. (B) Shannon and ACE indices for bacterial diversity in different groups. Asterisks indicate the statistical significance: *P-value <.05; **P-value <.01; ***P-value <.001 in the one-way ANOVA. (C) Whole profiles of the relative abundances of bacterial genus in D. gallinae across stages; all OTUs that accounted for <1% were combined “other.” EA and SA indicate the engorged adult female and starved adult female, respectively. (D) Phylogenetic analysis of the full-length 16S rRNA sequences of Bartonella A and related species. A maximum-likelihood phylogeny (model K2 + G + I) inferred from 1446 nucleotide sites are shown with bootstrap probability at each node. The color-labeled sequences are those obtained in this study. OTU of Bartonella from D. gallinae are shaded with light green and light red. Numbers in brackets indicate NCBI accession numbers.

