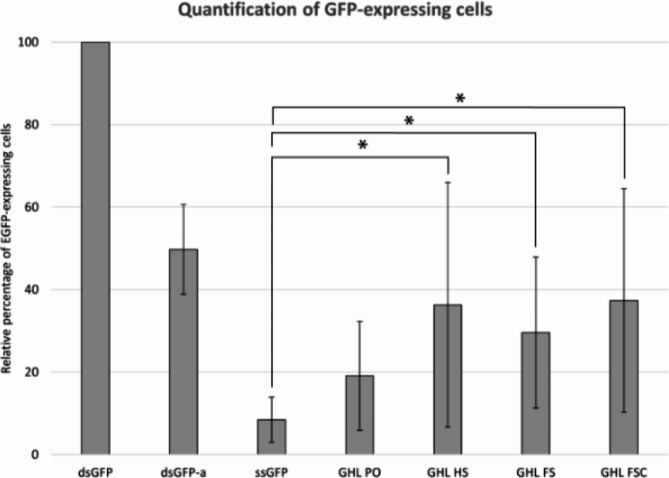
Fig. 5.
Quantification of GFP-expressing cells from various DNA samples. GFP-expressing cells were identified by flow cytometry. The percentage of GFP-expressing cells for each DNA sample was calculated and adjusted relative to a positive control (dsGFP). The average relative percentage of each sample is represented as a bar. Error bars represent one standard deviation from the mean of three independent experiments (* represents p-value less than 0.1). P-values were calculated by student t-test between DNA nanoparticle samples and ssGFP (negative control). The raw data is presented in Supplementary Table 6.

