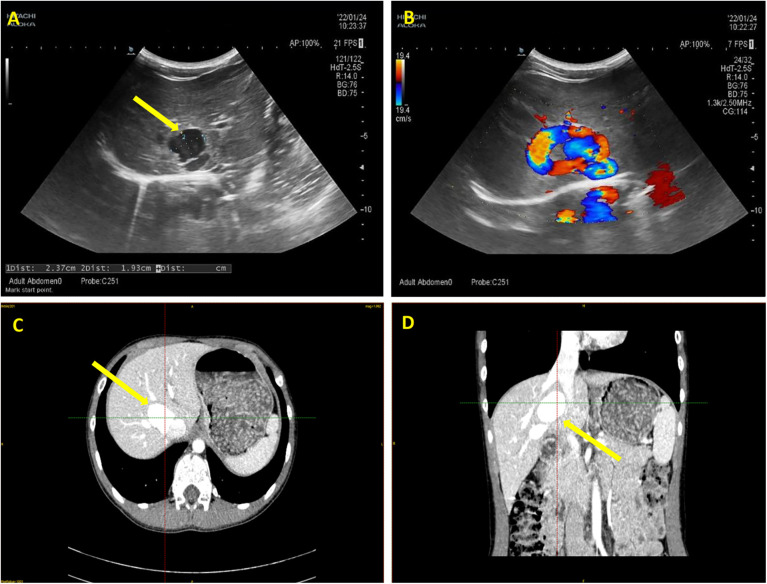
Figure 1.
Ultrasonography and enhanced computed tomography (CT) imaging of the patient abdomen. (A) The arrow highlights the tumor-like dilatation of the portal vein, demarcated by distinct boundaries. (B) Color Doppler ultrasound imaging verifies the directional flow from the portal vein to the inferior vena cava, with the flow velocity of 68.0 cm/s. (C) Transverse section and (D) Coronal section of enhanced CT images. The arrows indicate the tortuously dilated portal vein.

