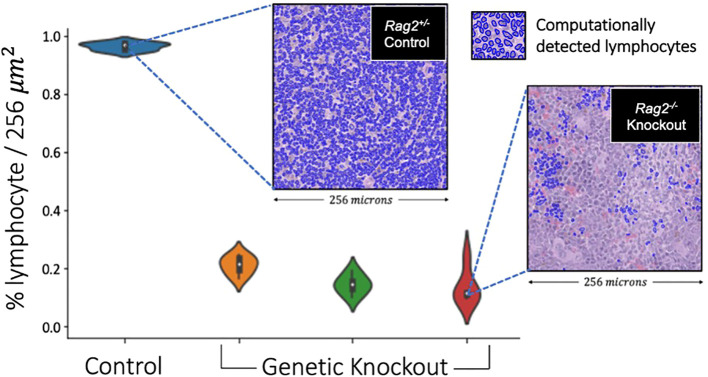
Figure 11.
Validation of lymphocyte identification by a deep learning model in a genetically engineered mouse model. The violin plots depict the distribution of lymphocyte percentage in the spleens across 256x256 image patches of different mice. The Rag2-/- genetic knockout mice demonstrated an average lymphocyte density of 16.2%, which was significantly smaller compared to the Rag2+/- experimental control mouse of >90% (p<0.0001, ANOVA). These experimental data suggest that our deep learning model generalized across species and tissue types, capturing at least the basic aspects of lymphocytic immune response.

