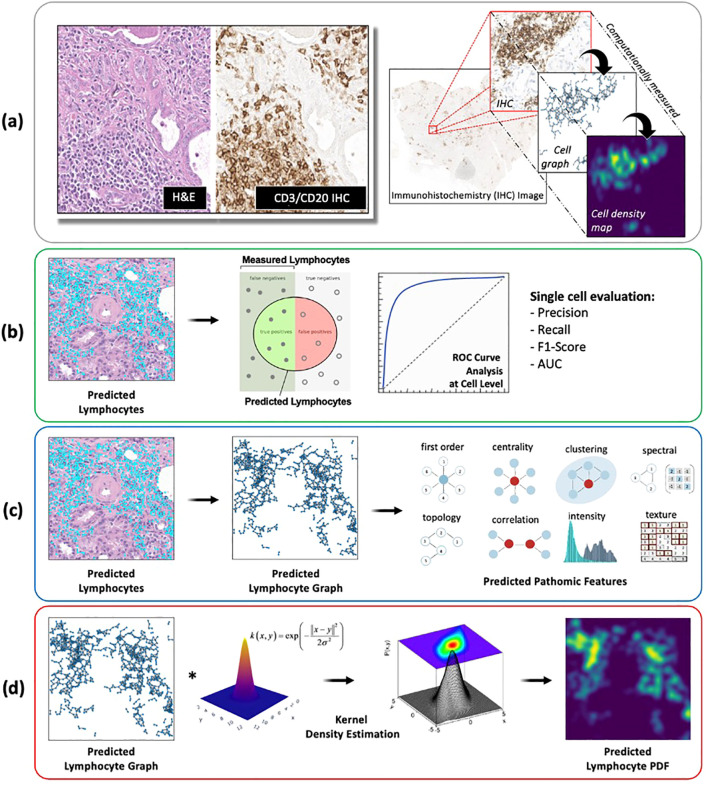
Figure 6.
Deep learning model evaluation metrics at different length-scales. (A) All deep learning results were compared to IHC-based computational measurements of nuclei counts, nuclei topological graphs, and nuclei density maps. (B) Local model performance of individual nuclei predictions was based on analysis of precision-recall curves and receiver operating characteristic (ROC) curves. (C, D) Global model performance of pattern-preserving features of the immune microenvironment was based on (C) extraction of graph features, where graph nodes represent individual lymphocytes detected via deep learning, and graph edges characterize the spatial connections between different lymphocytes; and (D) structural similarity of lymphocyte probability density functions (PDF), estimated based on a kernel density estimation of the predicted lymphocyte graphs using a radial basis function.

