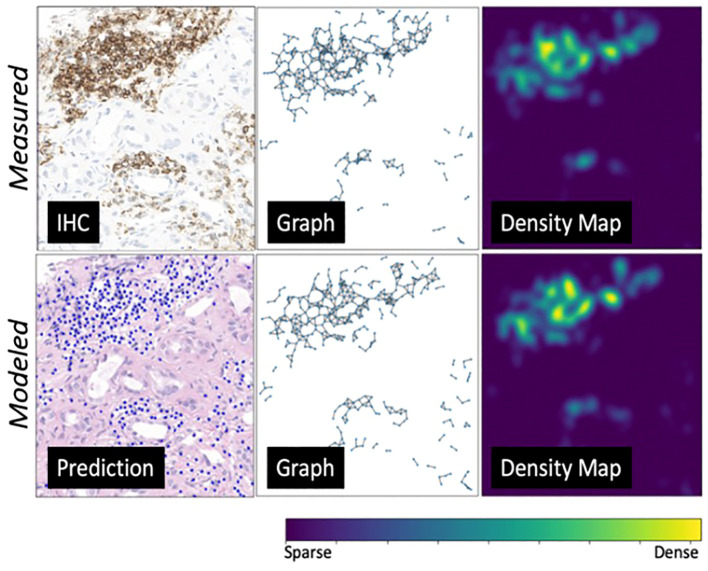
Figure 9.
An environmental-level modeling system example. From left to right are predicted lymphocytes, cell graphs showing spatial relationship among lymphocytes, and cell probability density maps (transformed from the cell graphs). The top row showcases the ground truth measurements, while the bottom row presents the modeled measurements. This figure illustrates a strong alignment between the ground truth and prediction model.

