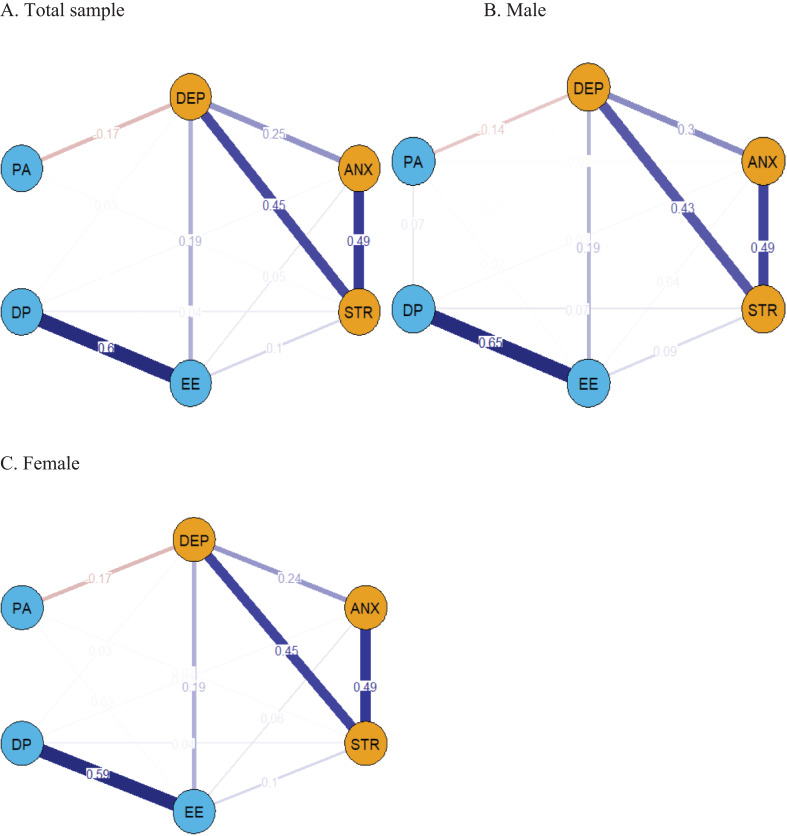
Figure 1.
The network structure between the three subscales in the DASS-21 and MBI-HSS questionnaire. Positive connections are graphically depicted with dark blue lines, while negative connections are shown with dark red lines. The thickness of the edges indicates the strength of the correlation. Nodes with stronger correlation tend to be closer together spatially. DEP, Depression; ANX, Anxiety; STR, Stress; EE, Emotional Exhaustion; DP, Depersonalization; PA, Personal Accomplishment. (A) represents the network structure of the population sample, while (B) represents the network structure of the male sample, and (C) represents the network structure of the female sample.

