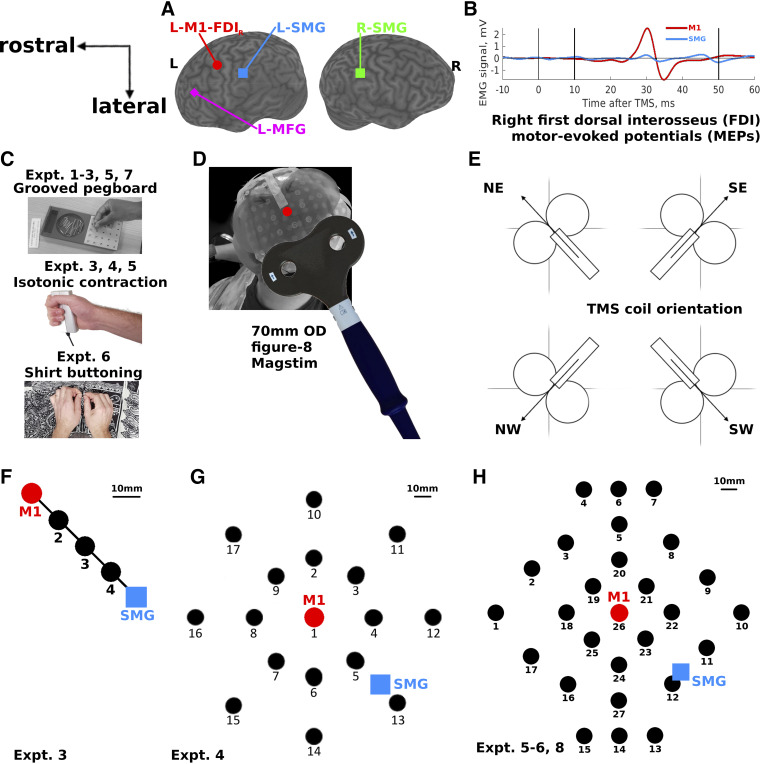
Figure 1.
Transcranial magnetic stimulation (TMS) over the left motor cortex (L-M1-FDIR, red circles), left and right supramarginal gyrus (L-SMG, blue squares; R-SMG, green square), left middle frontal gyrus (L-MFG, magenta diamond), and 3, 16, and 26 other scalp locations (black circles). A: the cortical locations targeted in experiments 1–3. B: example averaged motor-evoked potentials (MEPs) recorded from 60 TMS pulses in a single participant’s surface electromyography (EMG) over the right hand first dorsal interosseus (FDI) muscle (experiments 2b–7). The vertical lines show the TMS onset (0 ms) and the MEP analysis window between 10 ms and 50 ms. C, top: the Grooved Pegboard task used in experiments 1–3, 5, and 7. Middle: the isometric contraction task used in experiments 3, 4, and 5. Bottom: the shirt-buttoning task used in experiment 6. D: the 27-location map (H), as seen from behind and to the left of 1 participant. The cloth map has 27 numbered targets. A transparent plastic TMS coil template is fixed over the central location (red dot, M1, location 26), and a Magstim 70-mm-outer diameter (OD) figure-8 coil is shown in the approximate “North-East” orientation, with handle 45° to the midline, pointing posterolaterally. Figures 4, 6, 7, and 9 show data from this perspective. E: 4 of the 8 coil orientations used in the study. Circles represent the coil wings; the rectangle represents the coil handle; arrows represent the direction of induced current flow in the brain. Coil orientations were labeled according to compass directions of the induced current flow in the brain, where North (N) is toward the nasion; East (E) is toward the right preauricular point; South (S) is toward the inion; and West (W) is toward the left preauricular point. F: the 5 locations stimulated in experiment 3, from L-M1-FDIR to L-SMG in equidistant intervals; 10 mm scale bar reflects the average across participants. G: the 17 locations stimulated in experiment 4, with L-M1-FDIR in the center (1) and L-SMG approximately midway between locations 5 and 13. H: the 27 locations stimulated in experiments 5 and 6 and measured in experiment 8. The central location is L-M1-FDIR (26), and L-SMG is partway between locations 12 and 11.

