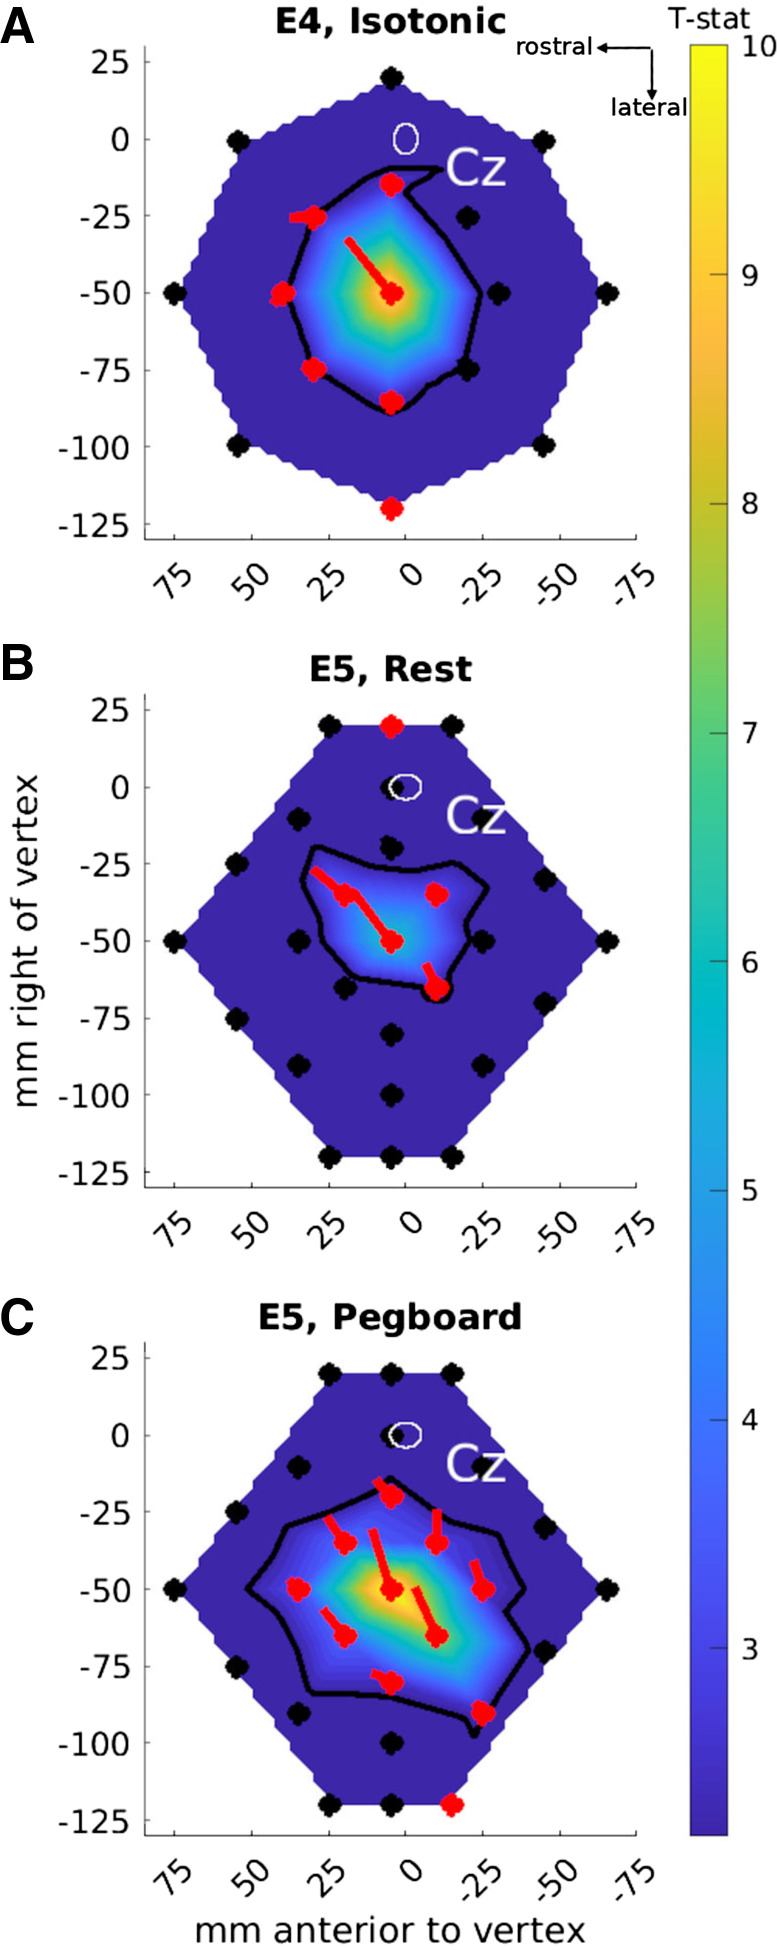
Figure 6.
Cartesian maps of motor-evoked potential (MEP) amplitudes (as t statistics compared to pre-TMS data, map color) and transcranial magnetic stimulation (TMS, monophasic) coil orientation preferences (oriented lines) in experiments 4 (A; 17 locations, N = 12) and 5 (B and C; 27 locations, N = 12). The map background colors show the interpolated t statistics comparing the mean MEP amplitudes after vs. before TMS across all stimulated locations [scale bar on right; thresholded at t(11) > 2.20, P < 0.05; nonsignificant t statistics are in deep blue]. TMS locations are shown as filled circles. Black symbols: no significant difference between pre- and post-TMS (i.e., no significant MEPs). Red symbols: significant differences [t(11) > 2.20, P < 0.05] between pre- and post-TMS. The oriented lines show the mean orientation preference vector for each location (red indicates vectors that were significantly greater in amplitude for post- compared to pre-TMS). The thick black contour line shows the interpolated threshold level: TMS presented at locations inside the contour induced significant MEPs. Cz: the white oval shows the mean ± 95% confidence ellipsoid for the origin of the map across participants, at the vertex, Cz[0,0]mm. Data are presented in the same perspective as the participant and brain in Fig. 1.

