
Figure 2.
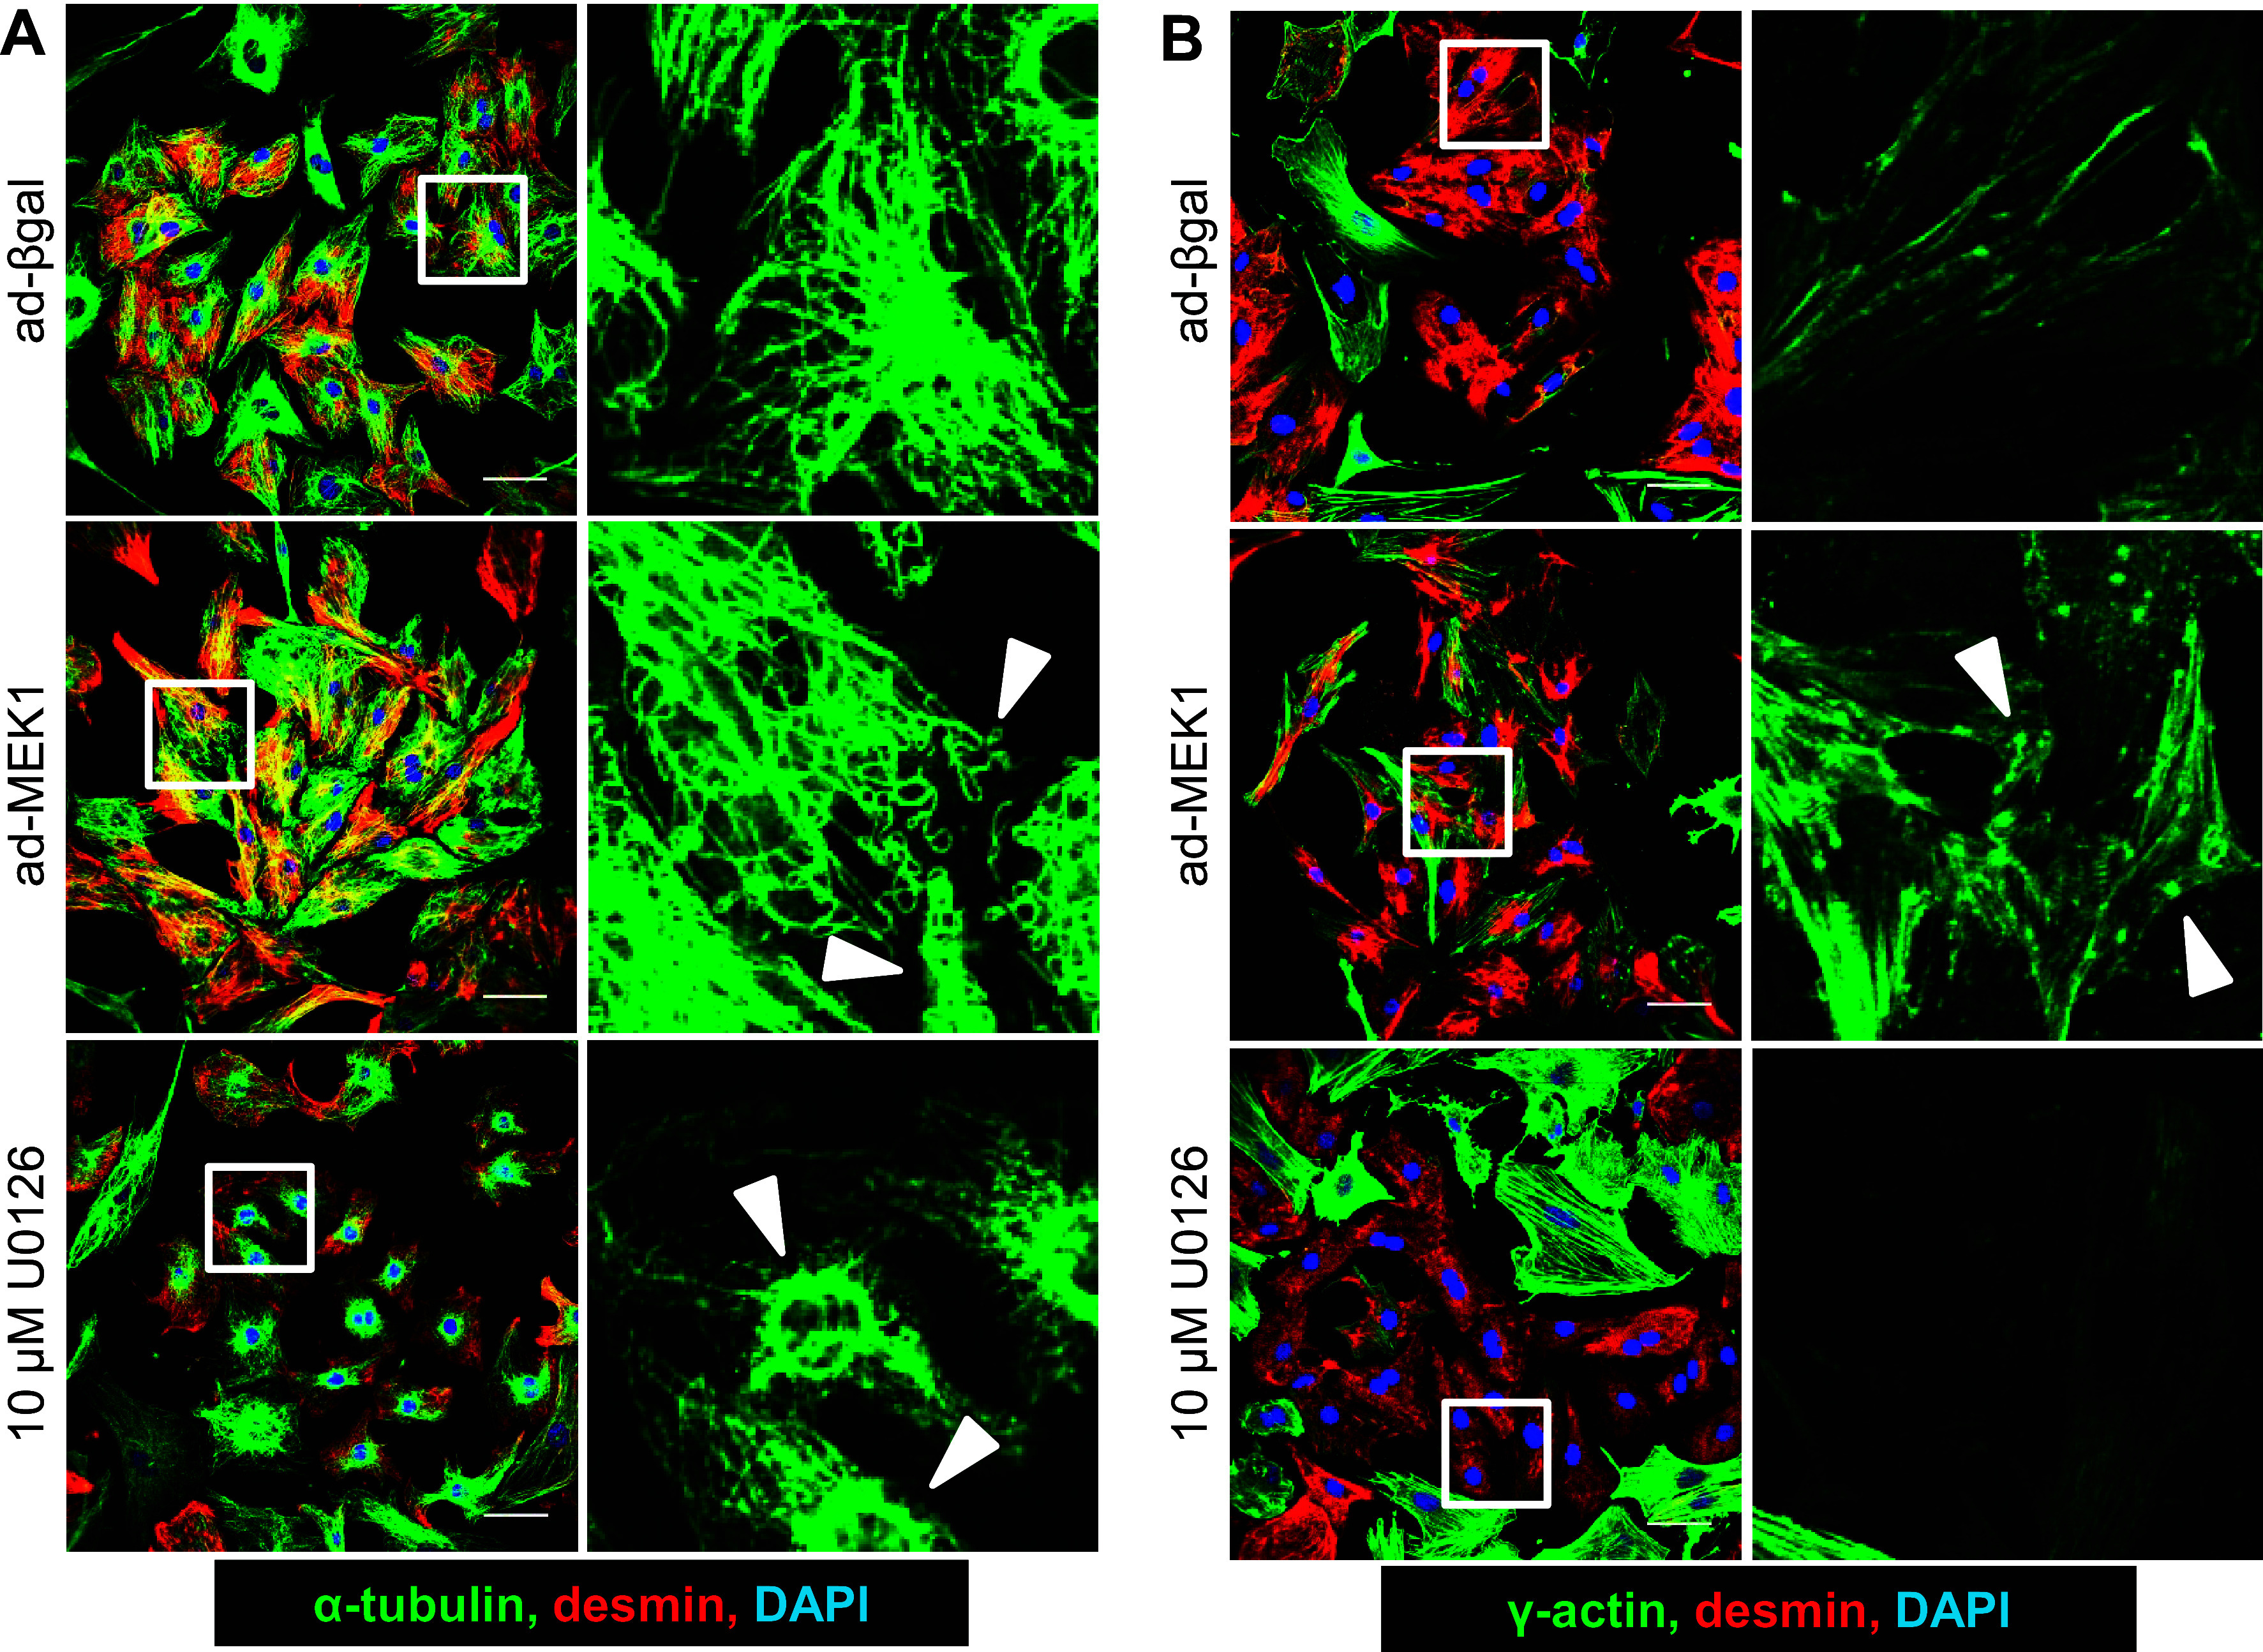
Cytoskeletal networks of neonatal rat ventricular myocytes (NRVMs) change with enhanced or inhibited MEK1-ERK1/2 signaling. A and B: representative immunocytochemistry images of cultured NRVMs treated with β-galactosidase adenovirus (ad-βGal) as control or activated MEK1 adenovirus (ad-MEK1) to activate signaling vs. 10 µM U0126 MEK1 inhibitor to block signaling. The fixed NRVM cultures were immunostained for α-tubulin (green; A) and γ-actin (green; B) and costained with desmin (red) and DAPI (blue). Right: each set are magnifications of their respectively associated white boxes at left. White arrows point to tubulin and actin structures that have changed among the conditions (NRVM cultures had a mixture of cells from both male and female hearts. Staining was repeated twice. Scale bars = 20 um).