Abstract
In this study, bupivacaine (BUP) and meloxicam (MLX) were simultaneously assayed in their co-formulated ampoules without interference using four affordable, sensitive, and eco-friendly spectrophotometric methods. The assay of MLX at 359.3 nm over the concentration range of 1.0–15.0 µg/mL was accomplished using a direct UV-spectrophotometric method (Method I) without interference from BUP. However, there was a significant overlap between the spectra of BUP and MLX, making it difficult to determine BUP directly from the UV spectrum. Therefore, various UV-based techniques, including second derivative spectrophotometry (Method II), ratio subtraction method (Method III), and absorption factor method (Method IV), were used to determine BUP over the concentration range of 5.0–80.0 µg/mL. The proposed methods could simultaneously determine the studied drugs with a challenging ratio of 33.3:1.0 (BUP: MLX), which increases the importance of the current study. The proposed methods were applied to estimate the studied drugs in commercial ampoules with high % recoveries and low %RSD values. The excellent eco-friendliness of the developed methods was demonstrated using GAPI and AGREE metrics. The developed methods were validated according to ICHQ2(R2) guidelines. The proposed methods can be better suited for the routine analysis of BUP and MLX in their fixed-dose combination with high selectivity.
Keywords: Bupivacaine, Meloxicam, Spectrophotometry, Greenness
Subject terms: Chemistry, Analytical chemistry
Introduction
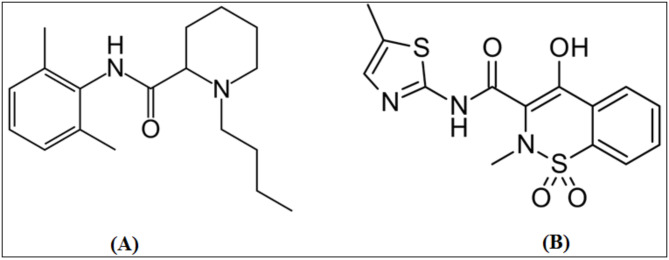
Bupivacaine (BUP) is a long-acting amide anaesthetic. Chemically, it is (RS)-1-butyl-N-(2,6-dimethyl phenyl) piperidine-2-carboxamide (Fig. 1A). In high doses, it works by blocking the nerve impulses that flow from sensory nerve terminals to motor nerve endings1.
Fig. 1.
Chemical formulae of Bupivacaine (A) and Meloxicam (B).
Meloxicam (MLX), is a non-steroidal anti-inflammatory medication (NSAID) from the enolic acid family that has been found to inhibit COX-2. Chemically, it is described as 4-hydroxy-2-methyl-(5-methyl-2-thiazolyl)-2H-1,2-benzothiazine-3-carboxamide-1,1-dioxide (Fig. 1B). MLX is used to treat osteoarthritis, rheumatoid arthritis, and other joint conditions2. Bupivacaine/meloxicam is a fixed-dose mixture of the NSAID meloxicam and the local anaesthetic bupivacaine, which is frequently indicated to relieve postoperative pain in the EU and USA3. For the determination of BUP, a variety of analytical techniques were reported, including spectrophotometry4, chromatography5–9, and electrochemistry10, while MLX has been assayed through the use of different spectroscopic methods11–15. Furthermore, MLX analysis in various dosage forms and biological matrices was reported in various chromatographic methods16–19.
Meanwhile, for the concurrent assay of BUP and MLX in co-formulated dosage forms, only two chromatographic methods20,21 have been published. In addition, two spectrophotometric methods were also recently reported for their concurrent analysis22,23. When compared to the reported chromatographic methods, the developed spectrophotometric methods are more affordable and straightforward, require less expensive instrumentation and small volumes of organic solvents, don’t need prior separation steps, and are more eco-friendly24. In addition, the proposed methods could simultaneously determine the studied drugs with a challenging ratio of 33.3:1.0 (BUP: MLX), magnifying the current study’s importance. Compared to the recently reported spectrophotometric methods, the developed methods in this work applied different UV-based techniques (second derivative spectrophotometry (Method II), ratio subtraction method (Method III), and absorption factor method (Method IV)). They exhibited about 20-fold higher sensitivity than the spectrophotometric method reported by El-Malla et al.22. Moreover, the developed methods showed tenfold higher sensitivity for BUP than the method reported by Bahgat et al.23. Therefore, the established procedures can be better suited for the routine analysis of BUP and MLX with high sensitivity and selectivity in medicinal formulations that combine both substances. Moreover, the green profile and ecofriendliness of the developed approaches were successfully evaluated using the Green Analytical Procedure Index (GAPI) and Analytical GREENNESS metric approach (AGREE), proving the excellent greenness of the proposed methods25,26.
Experimental
Apparatus
Shimadzu UV–Visible double-beam spectrophotometer (Kyoto, Japan) was utilized to conduct the spectrophotometric analyses. It was equipped with matching quartz cuvettes with a 1 cm path length. The 200–600 nm wavelength region of the absorption spectra of both medications was recorded using auto-sampling intervals, 1 nm slit width, and a rapid scan speed.
Using ∆λ = 4 nm and a scale factor of 100, the second derivative spectra for BUP were obtained.
Materials and reagents
HPLC-grade ethanol, acetonitrile, and methanol were obtained from Fisher Scientific UK, Loughborough, Leicestershire, UK. NaOH and HCl were provided by El-Nasr Pharmaceutical Co., Cairo, Egypt.
Bupivacaine HCl (99.90% purity) was generously supplied by Hikma Pharmaceuticals, 6th of October City, Giza, Egypt.
Meloxicam (99.40% purity) was kindly supplied by ADWIA, Cairo, Egypt.
Stock standard solutions
1000.0 µg/mL BUP and MLX stock solutions were prepared by dissolving 25.0 mg of each compound in methanol in a 25.0 mL volumetric flask. When maintained in a refrigerator at 2 °C, the solutions were shown to be stable for at least two weeks.
Calibration curves
Zero-order absorption spectra were measured with respect to methanol, which served as a reference. Accurately measured volumes of the stock solutions were transferred into a set of measuring flasks (10.0 mL), diluted to the desired concentration with the same solvent, and thoroughly mixed to get the final concentration in the range of (5.0–80.0) µg/mL of BUP and (1.0–15.0) µg/mL of MLX. The final drug concentrations (µg/mL) were plotted versus the absorbance values to create the calibration graphs, and the relevant regression equations were then derived.
Method (I): direct UV
Without interference from BUP, MLX was determined at λ 359.3 nm, as described under Section "Calibration curves".
Method (II): second derivative (D2)
The D2 amplitude values for BUP were recorded at 245.1 nm. The calibration graph and accompanying regression equation were then obtained by plotting the derivative amplitudes against the corresponding concentration.
Method (III): ratio subtraction (RS)
The RS method was used to detach the MLX spectrum for BUP estimation. The two drugs, BUP (A) and MLX (B), have overlapping spectra, with MLX’s spectrum being longer than that of BUP beyond 300 nm (Fig. 2). By dividing the overlapping spectra of the synthetic mixtures (A + B) by a carefully chosen MLX concentration (4.0 µg/mL) of standard B’ (divisor), an innovative ratio spectrum ([A + B] / B') is created. As BUP (A) has no absorbance in the plateau region (300–500 nm), the division obtained constant values of absorbance that is equal to (B / B') along this region. The ratio spectrum ([A + B] / B') is subtracted from the fixed absorbance values (B / B') to produce a new (A / B') spectrum. The original spectrum (A) was then produced by multiplying the acquired (A / B') spectrum by (B'). This obtained spectrum was then utilized to acquire the appropriate regression equation and determine BUP (A) at 224.7 nm.
Fig. 2.
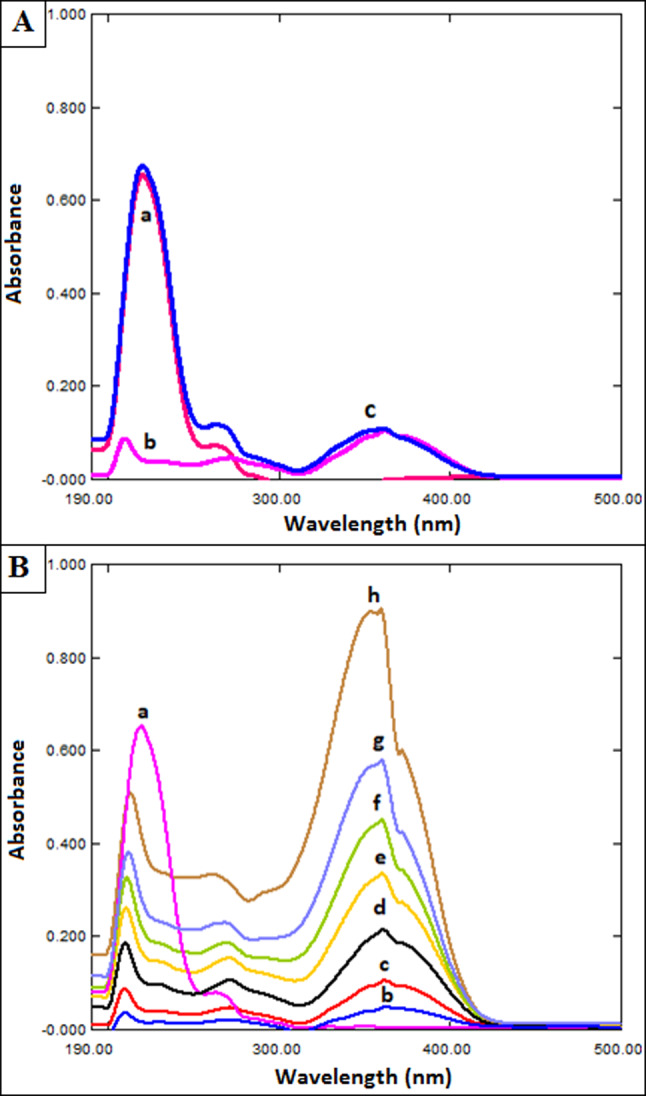
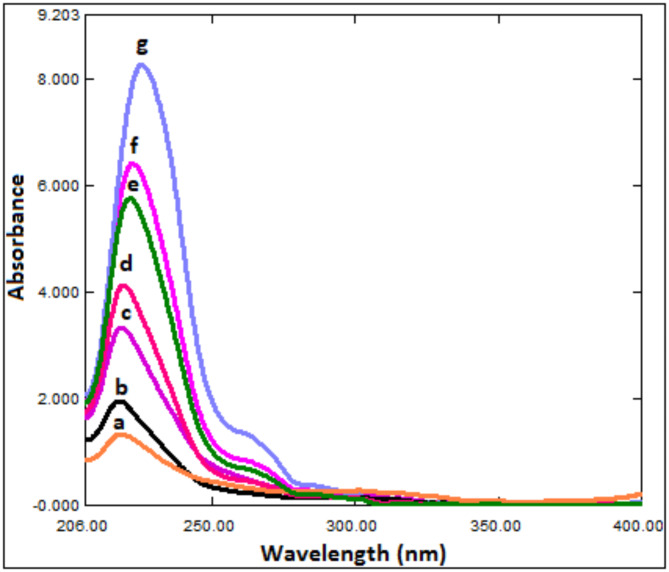
(A) Zero order absorption spectra of BUP (a; 33.3 μg/mL), MLX (b; 1.0 μg/mL), and mixture (c) in methanol, (B) Direct UV spectrophotometric spectra of MLX (b-h: 1.0, 2.0, 4.0, 6.0, 8.0, 10.0, 15.0 μg/mL) and a fixed concentration of BUP (a) (60.0 μg/mL).
Method (IV): absorption factor (AF) method
The first step was to create a calibration curve for BUP by graphing different concentrations (ranging from 5.0 to 80.0 µg/mL) against zero order absorbance amplitudes (A) at 224.7 nm (λ1). Second, the calibration curve for MLX was obtained by graphing different concentrations (ranging from 1.0 to 15.0 µg/mL) against zero-order absorbance amplitudes (A) at 224.7 nm (λ1). Thirdly, the zero-order absorbance amplitudes (A) at 359.3 nm (λ2) (λmax) against various concentrations (ranging from 1.0 to 15.0 µg/mL) were graphed to create the calibration curve for the MLX.
Laboratory-prepared mixtures
Because ampoules containing BUP and MLX are not available in Egyptian retailers, the laboratory-prepared mixture was used to mimic the dosage form. In a 100.0 mL measuring flask, methanol was used to dissolve precisely weighed amounts of 29.25 mg BUP, and 0.88 mg MLX with triacetin, dimethyl sulfoxide, maleic acid, and triethylene glycol/triethylene glycol polyglycolide copolymer as excipients. Then the procedures outlined under Section "Calibration curves" were used.
Results and discussion
As shown in Fig. 2, the overlay of the UV-spectra of BUP and MLX (in the ratio 33.3:1.0, BUP: MLX) demonstrates that MLX may be identified at 359.3 nm without interference from BUP, the regression equation was constructed for MLX at λ 359.3 nm as summarized in Table 1.
Table 1.
Analytical performance data for the estimation of BUP and MLX by the developed approaches.
| Parameter | BUP | MLX | |||
|---|---|---|---|---|---|
| Methods | D2 | RS | λmax | Direct | λmax |
| Wavelength (nm) | 245.1 | 224.7 | 224.7 | 359.3 | 224.7 |
| Linearity range (µg/mL) | 5.0–80.0 | 5.0–80.0 | 1.0–25.0 | 1.0–15.0 | 0.6–10.0 |
| Intercept (a) | -1.9 × 10⁻³ | 6.5 × 10⁻² | 7.7 × 10⁻² | -2.9 × 10⁻² | -1.5 × 10⁻³ |
| Slope (b) | 4.1 × 10⁻³ | 8.7 × 10⁻³ | 9.1 × 10⁻³ | 6.1 × 10⁻² | 2.4 × 10⁻² |
| Correlation coefficient (r) | 0.9999 | 0.9998 | 0.9999 | 0.9999 | 0.9998 |
| S.D. of residuals (Sy/x) | 1.5 × 10⁻² | 6.0 × 10⁻³ | 1.2 × 10⁻³ | 4.8 × 10⁻³ | 2.4 × 10⁻³ |
| S.D. of intercept (Sa) | 1.9 × 10⁻⁴ | 7.7 × 10⁻⁴ | 1.5 × 10⁻⁴ | 6.9 × 10⁻⁴ | 3.4 × 10⁻⁴ |
| S.D. of slope (Sb) | 2.0 × 10⁻⁵ | 9.0 × 10⁻⁵ | 2.0 × 10⁻⁵ | 4.0 × 10⁻⁴ | 2.0 × 10⁻⁴ |
| % RSD | 0.762 | 1.170 | 0.730 | 1.132 | 1.392 |
| % Error | 0.288 | 0.444 | 0.275 | 0.430 | 0.530 |
| LOD (µg/mL) | 0.16 | 0.29 | 0.05 | 0.04 | 0.05 |
| LOQ (µg/mL) | 0.47 | 0.88 | 0.16 | 0.11 | 0.15 |
However, there was a significant overlap between the spectra of BUP and MLX, making it difficult to identify BUP from a straight UV-spectrum. Such a challenge was handled by manipulation of UV-spectra utilizing multiple multi-component UV spectrophotometric approaches.
In order to simultaneously analyze BUP and MLX in a challenging ratio of 33.3: 1.0, four straightforward, quick, accurate, and green spectrophotometric methods are developed in this work. These methods included D2, RS, AF, and direct UV procedures (for BUP).
Method optimization
The impact of various variables on the performance of the suggested methods was extensively examined.
Selection of solvent
For the study of BUP and MLX, several solvents with different polarities, including distilled water, ethanol, methanol, acetonitrile, and aqueous solvents with various pH values, such as 0.1 M NaOH, 0.1 M HCl, borate buffer of pH 8, and acetate buffer of pH 4 were investigated. In order to enable the quantification of MLX in its combination with BUP, it was critical to improve MLX absorbance. After several trials, methanol demonstrated improved solubility properties and absorption intensities for both drugs. Therefore, to make the established procedures more sensitive, methanol was chosen for the preparation of the BUP and MLX solutions.
Scaling factor and delta lambda
Different scaling factor (SF) and delta lambda (∆λ) values were investigated in order to improve 2D performance. The best values were found to be ∆λ = 4 nm and SF = 100 after smoothing at ∆λ = 8 nm and SF = 1, which offered the highest absorption intensity with the least amount of noise, particularly in the case of low concentrations.
Methods’ characteristics
Method I: direct UV approach for MLX
As shown in Fig. 2, MLX can be measured at 359.3 nm without BUP interference.
Method II: 2D spectrophotometric approach for determination of BUP
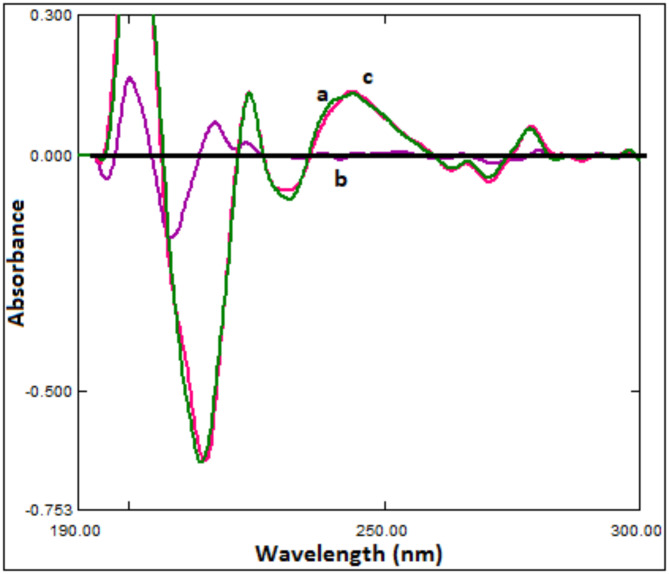
BUP was quantified by derivative spectrophotometry with zero-crossing points. As demonstrated in Fig. 3, using ∆λ = 4 nm and SF = 100, the zero-order UV spectrum of the binary mixture was converted into 2D. The wavelength used for BUP measurements was 245.1 nm since it displayed the highest 2D amplitude results (without MLX interference). Table 1 provides an illustration of the statistical characteristics of calibration curves.
Fig. 3.
Second derivative spectra of BUP (a 33.3 μg/mL), MLX (b 1.0 μg/mL) and a mixture of BUP (33.3 μg/mL) and MLX (1.0 μg/mL) (c) in methanol.
Method III: ratio subtraction (RS) approach for BUP
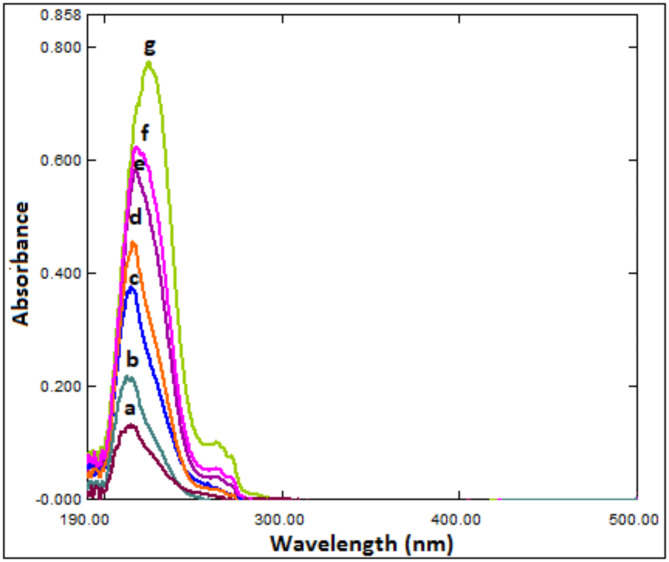
RS was used to remove the MLX spectrum. The method is based on the finding that the concentration of (A) can be calculated by dividing the zero-order absorption spectra of the laboratory-prepared mixtures (BUP and MLX) by (4.0 µg/mL) of standard MLX (B' = divisor) for a mixture of two drugs, BUP (A) and MLX (B), whose spectra overlap and (B) spectrum is extended beyond than that of (A) (Fig. 2). The new ratio spectrum presented in Fig. 4 is produced by multiplying the obtained spectra by the divisor (B'). The produced spectra are then multiplied by (B'), the divisor, after subtracting the absorbance values of these constants (B/B') in the plateau region (307–500 nm). A direct determination of BUP at 224.7 nm was then made using the original spectrum of (A) (Fig. 5).
Fig. 4.
Ratio spectrophotometric spectra of different concentrations of BUP using 3.0 μg/mL MLX as a divisor, where: (a-g) BUP at concentrations of (1.0, 2.0, 6.0, 10.0, 16.0, 20.0, 25.0 μg/mL).
Fig. 5.
Ratio subtraction UV spectrophotometric spectra of BUP using MLX as a divisor (3.0 μg/mL), where: (a-g) BUP at concentrations of (1.0, 2.0, 6.0, 10.0, 16.0, 20.0, 25.0 μg/mL).
Method IV: AF approach for BUP
At 359.3 nm (λmax of MLX), the concentration was calculated from its regression equation, and at 224.7 nm (λmax of BUP), the concentration was calculated by subtracting the absorption caused by the interfering drug.
The following equations were used to quantitatively estimate the amounts of BUP and MLX in the mixture:
1) Concentration of MLX at 359.3 nm
| 1 |
2) Calculated absorbance of MLX at 224.7 nm
| 2 |
3) So, the corrected absorbance of BUP at 224.7 nm
| 3 |
4) Calculation of BUP concentration at 224.7 nm
| 4 |
Methods’ validation
According to ICHQ2 (R2) guidelines27, the precision, accuracy, linearity, range, limit of quantitation (LOQ), limit of detection (LOD), and selectivity of the proposed methods were all estimated.
Linearity and range
Seven concentrations of BUP and MLX in the ranges of (5.0–80.0) and (1.0–15.0) µg/mL, respectively, were used to create calibration plots. Both BUP and MLX revealed linear relationships between concentrations and the obtained response. High values of the correlation coefficients (r) and low values of the standard deviation of intercepts (Sa), the standard deviation of residuals (Sy/x), and the standard deviation of slopes (Sb) were used to validate good linearity of the developed methods, as presented in Table 1.
LOD and LOQ
The following equations were used to establish the LOD and LOQ for BUP and MLX according to ICHQ2 (R2) guidelines.
where b denotes the slope of the calibration plot. The obtained values for LOD and LOQ demonstrated the sensitivity of the proposed approaches (Table 1).
Accuracy and precision
Both BUP and MLX raw materials were analyzed using the suggested procedures over the specified concentration ranges. The excellent accuracy of the suggested procedures was confirmed by the high values of % recoveries and the low values of % Error (Table 2). Moreover, by measuring three distinct drug concentrations at three different time intervals throughout the same day and over the course of three different days, respectively, the intra-day and inter-day precisions were confirmed. Low percentages of RSD and error were evidence of the proposed methods’ precision, as displayed in Table 3.
Table 2.
Results of the application of the developed approaches for the estimation of BUP and MLX raw materials.
| Parameters | Drug | BUP | MLX | ||||
|---|---|---|---|---|---|---|---|
| Method | D2 | RS | λmax | λmax | UV direct | ||
| at (245 nm) | at (224.7 nm) | at (224.7 nm) | at (224.7 nm) | at (359.3 nm) | |||
| Taken Conc. (µg/mL) | Founda Conc. (µg/mL) | Founda Conc. (µg/mL) | Founda Conc. (µg/mL) | Taken Conc. (µg/mL) | Founda Conc. (µg/mL) | Founda Conc. (µg/mL) | |
| 5.0 | 4.973 | 5.000 | 4.943 | 1.0 | 0.995 | 1.016 | |
| 10.0 | 9.974 | 9.901 | 9.887 | 2.0 | 1.969 | 2.015 | |
| 20.0 | 19.975 | 20.377 | 20.085 | 4.0 | 4.09 | 4.058 | |
| 30.0 | 29.728 | 30.415 | 30.094 | 6.0 | 5.996 | 6.045 | |
| 50.0 | 50.714 | 50.25 | 79.811 | 8.0 | 8.03 | 7.893 | |
| 60.0 | 60.221 | 59.335 | 50.103 | 10.0 | 9.808 | 9.902 | |
| 80.0 | 79.73 | 80.999 | 59.335 | 15.0 | 15.064 | 15.09 | |
| Mean (X¯) | 99.95 | 100.42 | 99.62 | 99.86 | 100.40 | ||
| ± SD | 0.76 | 1.18 | 0.73 | 1.39 | 1.14 | ||
| % RSD | 0.762 | 1.170 | 0.730 | 1.392 | 1.132 | ||
| % Error | 0.288 | 0.444 | 0.275 | 0.525 | 0.430 | ||
aEach result is the average of three separate determinations.
Table 3.
Results of precision study for the estimation of BUP and MLX by the developed approaches.
| Drugs | Drug conc. µg/mL | Method | Intra-day | Inter-day | ||||||
|---|---|---|---|---|---|---|---|---|---|---|
| % Founda | ± SD | % RSD | % Error | % Founda | ± SD | % RSD | % Error | |||
| BUP | 20.0 | D2 | 100.13 | 0.513 | 0.512 | 0.296 | 99.73 | 0.493 | 0.495 | 0.286 |
| 30.0 | 100.15 | 0.673 | 0.672 | 0.388 | 99.8 | 0.492 | 0.493 | 0.285 | ||
| 50.0 | 99.83 | 0.808 | 0.81 | 0.468 | 99.81 | 0.415 | 0.416 | 0.24 | ||
| 20.0 | RS | 100.2 | 0.721 | 0.72 | 0.416 | 100.23 | 0.208 | 0.208 | 0.12 | |
| 30.0 | 99.9 | 0.625 | 0.625 | 0.361 | 99.87 | 0.503 | 0.504 | 0.291 | ||
| 50.0 | 99.63 | 0.404 | 0.406 | 0.234 | 99.77 | 0.351 | 0.352 | 0.203 | ||
| MLX | 4.0 | UV direct | 99.87 | 0.681 | 0.682 | 0.394 | 100.2 | 0.656 | 0.654 | 0.378 |
| 6.0 | 100.17 | 0.321 | 0.321 | 0.185 | 99.7 | 0.436 | 0.437 | 0.252 | ||
| 8.0 | 99.33 | 0.777 | 0.782 | 0.451 | 99.54 | 0.627 | 0.63 | 0.364 | ||
aEach result is the mean of 3 separate determinations.
Selectivity
The determination of BUP and MLX in their prepared co-formulated ampoules was achieved using the suggested procedures. The developed spectrophotometric methods were successfully employed to determine BUP and MLX without any interference from the excipients. The outcomes demonstrate the selectivity of the suggested procedures as revealed by the high % recoveries and the low % RSD values shown in Table 4.
Table 4.
Analysis outcomes for the estimation of BUP and MLX in prepared ampoules using the developed approaches.
| Mix. No | Taken conc. (µg/mL) | D2 | RD | AF | UV-direct | |
|---|---|---|---|---|---|---|
| Founda conc. (µg/mL) | Founda conc. (µg/mL) | Founda conc. (µg/mL) | Taken Conc. (µg/mL) | Founda Conc. (µg/mL) | ||
| BUP | MLX | |||||
| 1 | 33.3 | 33.1 | 33.03 | 33.1 | 1.0 | 0.99 |
| 2 | 50.0 | 50.1 | 50.25 | 50.4 | 1.5 | 1.51 |
| 3 | 66.6 | 66.27 | 66.4 | 66.87 | 2.0 | 2.00 |
| Mean | 99.7 | 99.8 | 100.2 | 99.97 | ||
| ± S.D | 0.436 | 0.656 | 0.721 | 0.666 | ||
| % RSD | 0.437 | 0.657 | 0.72 | 0.666 | ||
| % Error | 0.252 | 0.379 | 0.416 | 0.385 | ||
aEach result is the average of three separate determinations.
Methods applications
Assay of ampoules
The estimation of various ratios of BUP and MLX in their prepared ampoules was successfully accomplished using the suggested spectrophotometric techniques. The obtained high percent recoveries and low percent RSD values show the high selectivity of the developed methods (Table 4). Therefore, they can be better suited for the routine analysis of the cited drugs in quality control laboratories.
Evaluation of greenness of the proposed methods
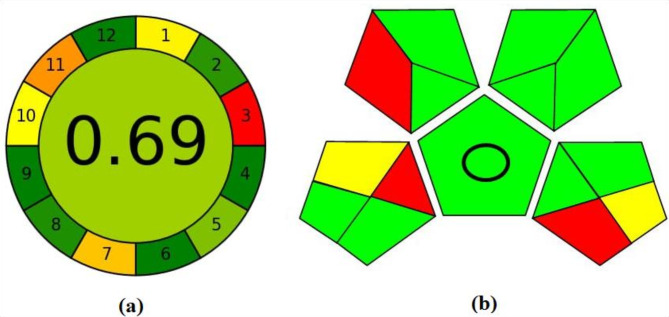
Analysts have an essential role in both human and environment protection from solvents and organic hazardous produced from pharmaceutical and chemical preparations. Therefore, different greenness evaluation metrics were developed to assess the green profiles of the analytical methods28–38. From these methods, two tools were applied to evaluate the proposed methods’ greenness, including AGREE and GAPI25,26. By weighing 12 important criteria, AGREE is a tool for identifying the occupational and environmental hazards included in the analytical process. The range of the result is 0 to 1.0. Figure 6a illustrates how the approaches generated positive results and a high score (0.69), showcasing adequate green methodologies. Additionally, GAPI was used, and as presented in Fig. 6b, the developed methods are direct methods (no extraction procedure). Small quantities of non-toxic chemicals with minimal waste are required for all techniques. The developed methods also include qualification and quantification.
Fig. 6.
Evaluation of the greenness profile of the proposed methods using (a) AGREE, (b) GAPI.
Conclusion
In order to simultaneously analyze BUP and MLX in a challenging ratio of 33.3:1.0, four straightforward, accurate, and green spectrophotometric methods were developed. These methods included D2, RD, RS, and AF (for BUP), as well as direct UV approaches (for MLX). The developed procedures proved to be suitable for the routine analysis of BUP and MLX in their co-formulated ampoules with high % recoveries and low % RSD values. The proposed univariate approaches offer wider linearity ranges for both medications and call for less in the way of mathematical manipulation, which gives the suggested approaches various merits over the reported chromatographic ones. In addition, the developed spectrophotometric approaches are more affordable and straightforward, requiring less expensive instruments, don’t need prior separation steps or high volumes of organic solvents, and are more environmentally friendly than the previously reported techniques used for concurrent assay of BUP and MLX.
Author contributions
A.S.R.: Conceptualization, Methodology, Formal analysis, Validation, Data curation, Writing-original draft. M.M.S.: Conceptualization, Data curation, Investigation, Writing-review & editing. F.B.: Conceptualization, Data curation, Investigation, Project administration, Writing-review & editing. G.M.: Conceptualization, Methodology, Formal analysis, Data curation, Visualization, Writing-original draft, Writing-review & editing. All authors approved the manuscript for publication.
Funding
Open access funding provided by The Science, Technology & Innovation Funding Authority (STDF) in cooperation with The Egyptian Knowledge Bank (EKB).
Data availability
The datasets generated and/or analyzed during the current study are available from the corresponding author on reasonable request.
Declarations
Competing interests
The authors declare no competing interests.
Footnotes
Publisher’s note
Springer Nature remains neutral with regard to jurisdictional claims in published maps and institutional affiliations.
References
- 1.National Center for Biotechnology Information (2023). PubChem Compound Summary for CID 2474, Bupivacaine. Retrieved April 10, 2023 from https://pubchem.ncbi.nlm.nih.gov/compound/Bupivacaine.
- 2.National Center for Biotechnology Information (2023). PubChem Compound Summary for CID 54677470, Meloxicam. Retrieved April 10, 2023 from https://pubchem.ncbi.nlm.nih.gov/compound/Meloxicam.
- 3.Blair, H. A. Bupivacaine/meloxicam prolonged release: A review in postoperative pain. Drugs81, 1203–1211 (2021). [DOI] [PubMed] [Google Scholar]
- 4.Corciova, A. J. E. C. B. Spectrophotometric method for determination of bupivacaine hydrochloride in pharmaceutical preparations. Eur. Chem. Bull.2, 554–557 (2013). [Google Scholar]
- 5.Koehler, A., Oertel, R. & Kirch, W. J. J. O. C. A. Simultaneous determination of bupivacaine, mepivacain, prilocaine and ropivacain in human serum by liquid chromatography–tandem mass spectrometry. J. Chromatogr. A1088, 126–130 (2005). [DOI] [PubMed] [Google Scholar]
- 6.Lindberg, R. L. P., Kanto, J. H. & Pihlajamäki, K. K. Simultaneous determination of bupivacaine and its two metabolites, desbutyl- and 4′-hydroxybupivacaine, in human serum and urine. J. Chromatogr. B383, 357–364 (1986). [DOI] [PubMed] [Google Scholar]
- 7.Qin, W.-W. et al. Simultaneous determination of procaine, lidocaine, ropivacaine, tetracaine and bupivacaine in human plasma by high-performance liquid chromatography. J. Chromatogr. B878, 1185–1189 (2010). [DOI] [PubMed] [Google Scholar]
- 8.Tanaka, E., Nakamura, T., Inomata, S. & Honda, K. Simultaneous determination of three local anesthetic drugs from the pipecoloxylidide group in human serum by high-performance liquid chromatography. J. Chromatogr. B834, 213–216 (2006). [DOI] [PubMed] [Google Scholar]
- 9.Tonooka, K. et al. Sensitive liquid chromatography/tandem mass spectrometry method for the simultaneous determination of nine local anesthetic drugs. Forensic Sci. Int.265, 182–185 (2016). [DOI] [PubMed] [Google Scholar]
- 10.Demir, E., İnam, O., Silah, H. & Karimi-Maleh, H. Studies of mechanism, kinetic model and determination of bupivacaine and its application pharmaceutical forms. Microchem. J.159, 105531 (2020). [Google Scholar]
- 11.Bebawy, L. I. Stability-Indicating Method for the Determination of Meloxicam and Tetracaine Hydrochloride in the Presence of their Degradation Products. Spectrosc. Lett.31, 797–820 (1998). [Google Scholar]
- 12.Mandrescu, M., Spac, A. F. & Dorneanu, V. J. R. C. Spectrophotometric determination of meloxicam. Rev. Chim.60, 160–163 (2009). [Google Scholar]
- 13.Gurupadayya, B. M., Trinath, M. & Shilpa, K. Spectrophotometric determination of meloxicam by sodium nitroprusside and 1,10-phenanthroline reagents in bulk and its pharmaceutical formulation. Indian J. Chem. Technol.20, 111–115 (2013). [Google Scholar]
- 14.Dhandapani, B. et al. spectrophotometric estimation of meloxicam in bulk and its pharmaceutical formulations. Int. J. Pharm. Sci. Res.1, 217–221 (2010). [Google Scholar]
- 15.Hassan, E. M. Spectrophotometric and fluorimetric methods for the determination of meloxicam in dosage forms. J. Pharm. Biomed. Anal.27, 771–777 (2002). [DOI] [PubMed] [Google Scholar]
- 16.Joseph-Charles, J. & Bertucat, M. Determination of meloxicam in tablet formulations by ultraviolet spectrophotometry and high-performance liquid chromatography. Anal. Lett.32, 2051–2059 (1999). [Google Scholar]
- 17.Velpandian, T., Jaiswal, J., Bhardwaj, R. K. & Gupta, S. K. Development and validation of a new high-performance liquid chromatographic estimation method of meloxicam in biological samples. J. Chromatogr. B738, 431–436 (2000). [DOI] [PubMed] [Google Scholar]
- 18.Sane, R. T. & Surve, V. Reversed phase high performance liquid chromatographic determination of meloxicam from human plasma using an internal standard. Indian Drugs37, 251–254 (2000). [Google Scholar]
- 19.Joseph-Charles, J. & Bertucat, M. Simultaneous high performance liquid chromatographic analysis of non-steroidal anti-inflammatory oxicams in pharmaceutical preparations. J. Liq. Chromatogr. Related. Technol.22, 2009–2021 (1999). [Google Scholar]
- 20.Seles, K. S. et al. Development and validation of stability indicating assay for simultaneous determination of bupivacaine and meloxicam in bulk and pharmaceutical formulations by using Rp-Hplc method. Int. J. Life Sci. Pharma Res.12, 117–131 (2022). [Google Scholar]
- 21.Siddareddy, K., Reddy, M. A. U., Suresh, B. & Sreeramulu, J. J. P. M. Development and validation of analytical method for simultaneous estimation of bupivacaine and meloxicam in human plasma using UPLC-MS/MS. Methods9, 2–8 (2018). [Google Scholar]
- 22.El-Malla, S. F., Hamza, A. A. & Elagamy, S. H. Simultaneous determination of meloxicam and bupivacaine via a novel modified dual wavelength method and an advanced chemometric approach. Sci. Rep.14, 1893 (2024). [DOI] [PMC free article] [PubMed] [Google Scholar]
- 23.Bahgat, E. A., Hashem, H., Saleh, H., Kamel, E. B. & Eissa, M. S. Manipulation and processing of spectral signals for the assay of the newly authorized mixture of bupivacaine/meloxicam using fully green solvents and a comparative green evaluation supporting the greenness and sustainability of the developed smart spectrophotometric methods. J. AOAC Int., qsad029 (2023). [DOI] [PubMed]
- 24.Radwan, A. S., Salim, M. M., Hadad, G. M., Belal, F. & Elkhoudary, M. M. Simultaneous estimation of recently FDA approved co-formulated ophthalmic solution benoxinate and fluorescein: Application to aqueous humor. Spectrochim. Acta A.267, 120599 (2022). [DOI] [PubMed] [Google Scholar]
- 25.Pena-Pereira, F., Wojnowski, W. & Tobiszewski, M. AGREE—Analytical GREEnness metric approach and software. Anal. Chem.92, 10076–10082 (2020). [DOI] [PMC free article] [PubMed] [Google Scholar]
- 26.Płotka-Wasylka, J. A new tool for the evaluation of the analytical procedure: Green Analytical Procedure Index. Talanta181, 204–209 (2018). [DOI] [PubMed] [Google Scholar]
- 27.ICH Q2 (R2) Guidelines, Validation of analytical procedures. ICH: Geneva (2022).
- 28.Alossaimi, M. A., Alqahtani, S. M., Elmansi, H., Belal, F. & Magdy, G. A novel synchronous fluorescence approach for the simultaneous determination of tafamidis and carvedilol in human plasma at nanogram levels: Compliance with greenness metrics. Michrochem. J.205, 111301 (2024). [Google Scholar]
- 29.Elhak, S., El-Shabrawy, Y., Belal, F. & Magdy, G. A novel green synthesis of silver nanoparticles from Anisosciadium seeds extract as sensitive fluorescent nanosensors for determination of esomeprazole and lansoprazole in dosage forms and human plasma. Michrochem. J.206, 111641 (2024). [Google Scholar]
- 30.Radwan, A. S. et al. Carbon quantum dots as nanosensors for the spectrofluorimetric determination of meloxicam in biological fluids and dosage forms: Greenness assessment and application to content uniformity testing. Sustain. Chem. Pharm.41, 101691 (2024). [Google Scholar]
- 31.Magdy, G., Belal, F. & El-Deen, A. K. Green synchronous spectrofluorimetric method for the simultaneous determination of agomelatine and venlafaxine in human plasma at part per billion levels. Sci. Rep.12, 22559 (2022). [DOI] [PMC free article] [PubMed] [Google Scholar]
- 32.Magdy, G., Saad Radwan, A., Belal, F. & Kamal El-Deen, A. Simple and affordable synchronous spectrofluorimetric determination of the natural anticancer polyphenols; resveratrol and curcumin in human plasma. Spectrochim. Acta A.302, 123029 (2023). [DOI] [PubMed] [Google Scholar]
- 33.El-Deen, A. K., Radwan, A. S., Belal, F. & Magdy, G. Spider diagram with greenness evaluation metrics for assessing the new synchronous spectrofluorimetric determination of bicalutamide and resveratrol in human plasma. Luminescence38, 1996–2006 (2023). [DOI] [PubMed] [Google Scholar]
- 34.Alossaimi, M. A., Altamimi, A. S. A., Elmansi, H. & Magdy, G. Green synthesized nitrogen-doped carbon quantum dots for the sensitive determination of larotrectinib in biological fluids and dosage forms: Evaluation of method greenness and selectivity. Spectrochim. Acta A.300, 122914 (2023). [DOI] [PubMed] [Google Scholar]
- 35.Magdy, G., Elmansi, H., Samaha, M. M., Said, E. & El-Enany, N. A Novel quality-by-design optimized spectrofluorimetric approach for estimation of the oral synthetic adiponectin receptor agonist AdipoRon in different biological matrices: Compliance with greenness metrics. Sustain. Chem. Pharm.37, 101424 (2024). [Google Scholar]
- 36.Magdy, G. et al. Ultrasensitive spectrofluorimetric approach for quantitation of the novel antiparkinsonian drug safinamide in different matrices at nanogram levels: Assessment of greenness and whiteness profiles. Sustain. Chem. Pharm.38, 101448 (2024). [Google Scholar]
- 37.Alossaimi, M. A., Altamimi, A. S. A., Elmansi, H. & Magdy, G. A green sustainable ultrasensitive micelle-sensitized spectrofluorimetric approach for the estimation of tafamidis in different matrices at picogram levels. Sustain. Chem. Pharm.36, 101321 (2023). [Google Scholar]
- 38.Magdy, G., Elmansi, H., Shabana, R. A. & El-Enany, N. A sustainable sensitive spectrofluorimetric approach for the determination of the multipotent protein lactoferrin in different pharmaceuticals and infant milk formula: Compliance with greenness metrics. Luminescence39, e4772 (2024). [DOI] [PubMed] [Google Scholar]
Associated Data
This section collects any data citations, data availability statements, or supplementary materials included in this article.
Data Availability Statement
The datasets generated and/or analyzed during the current study are available from the corresponding author on reasonable request.


