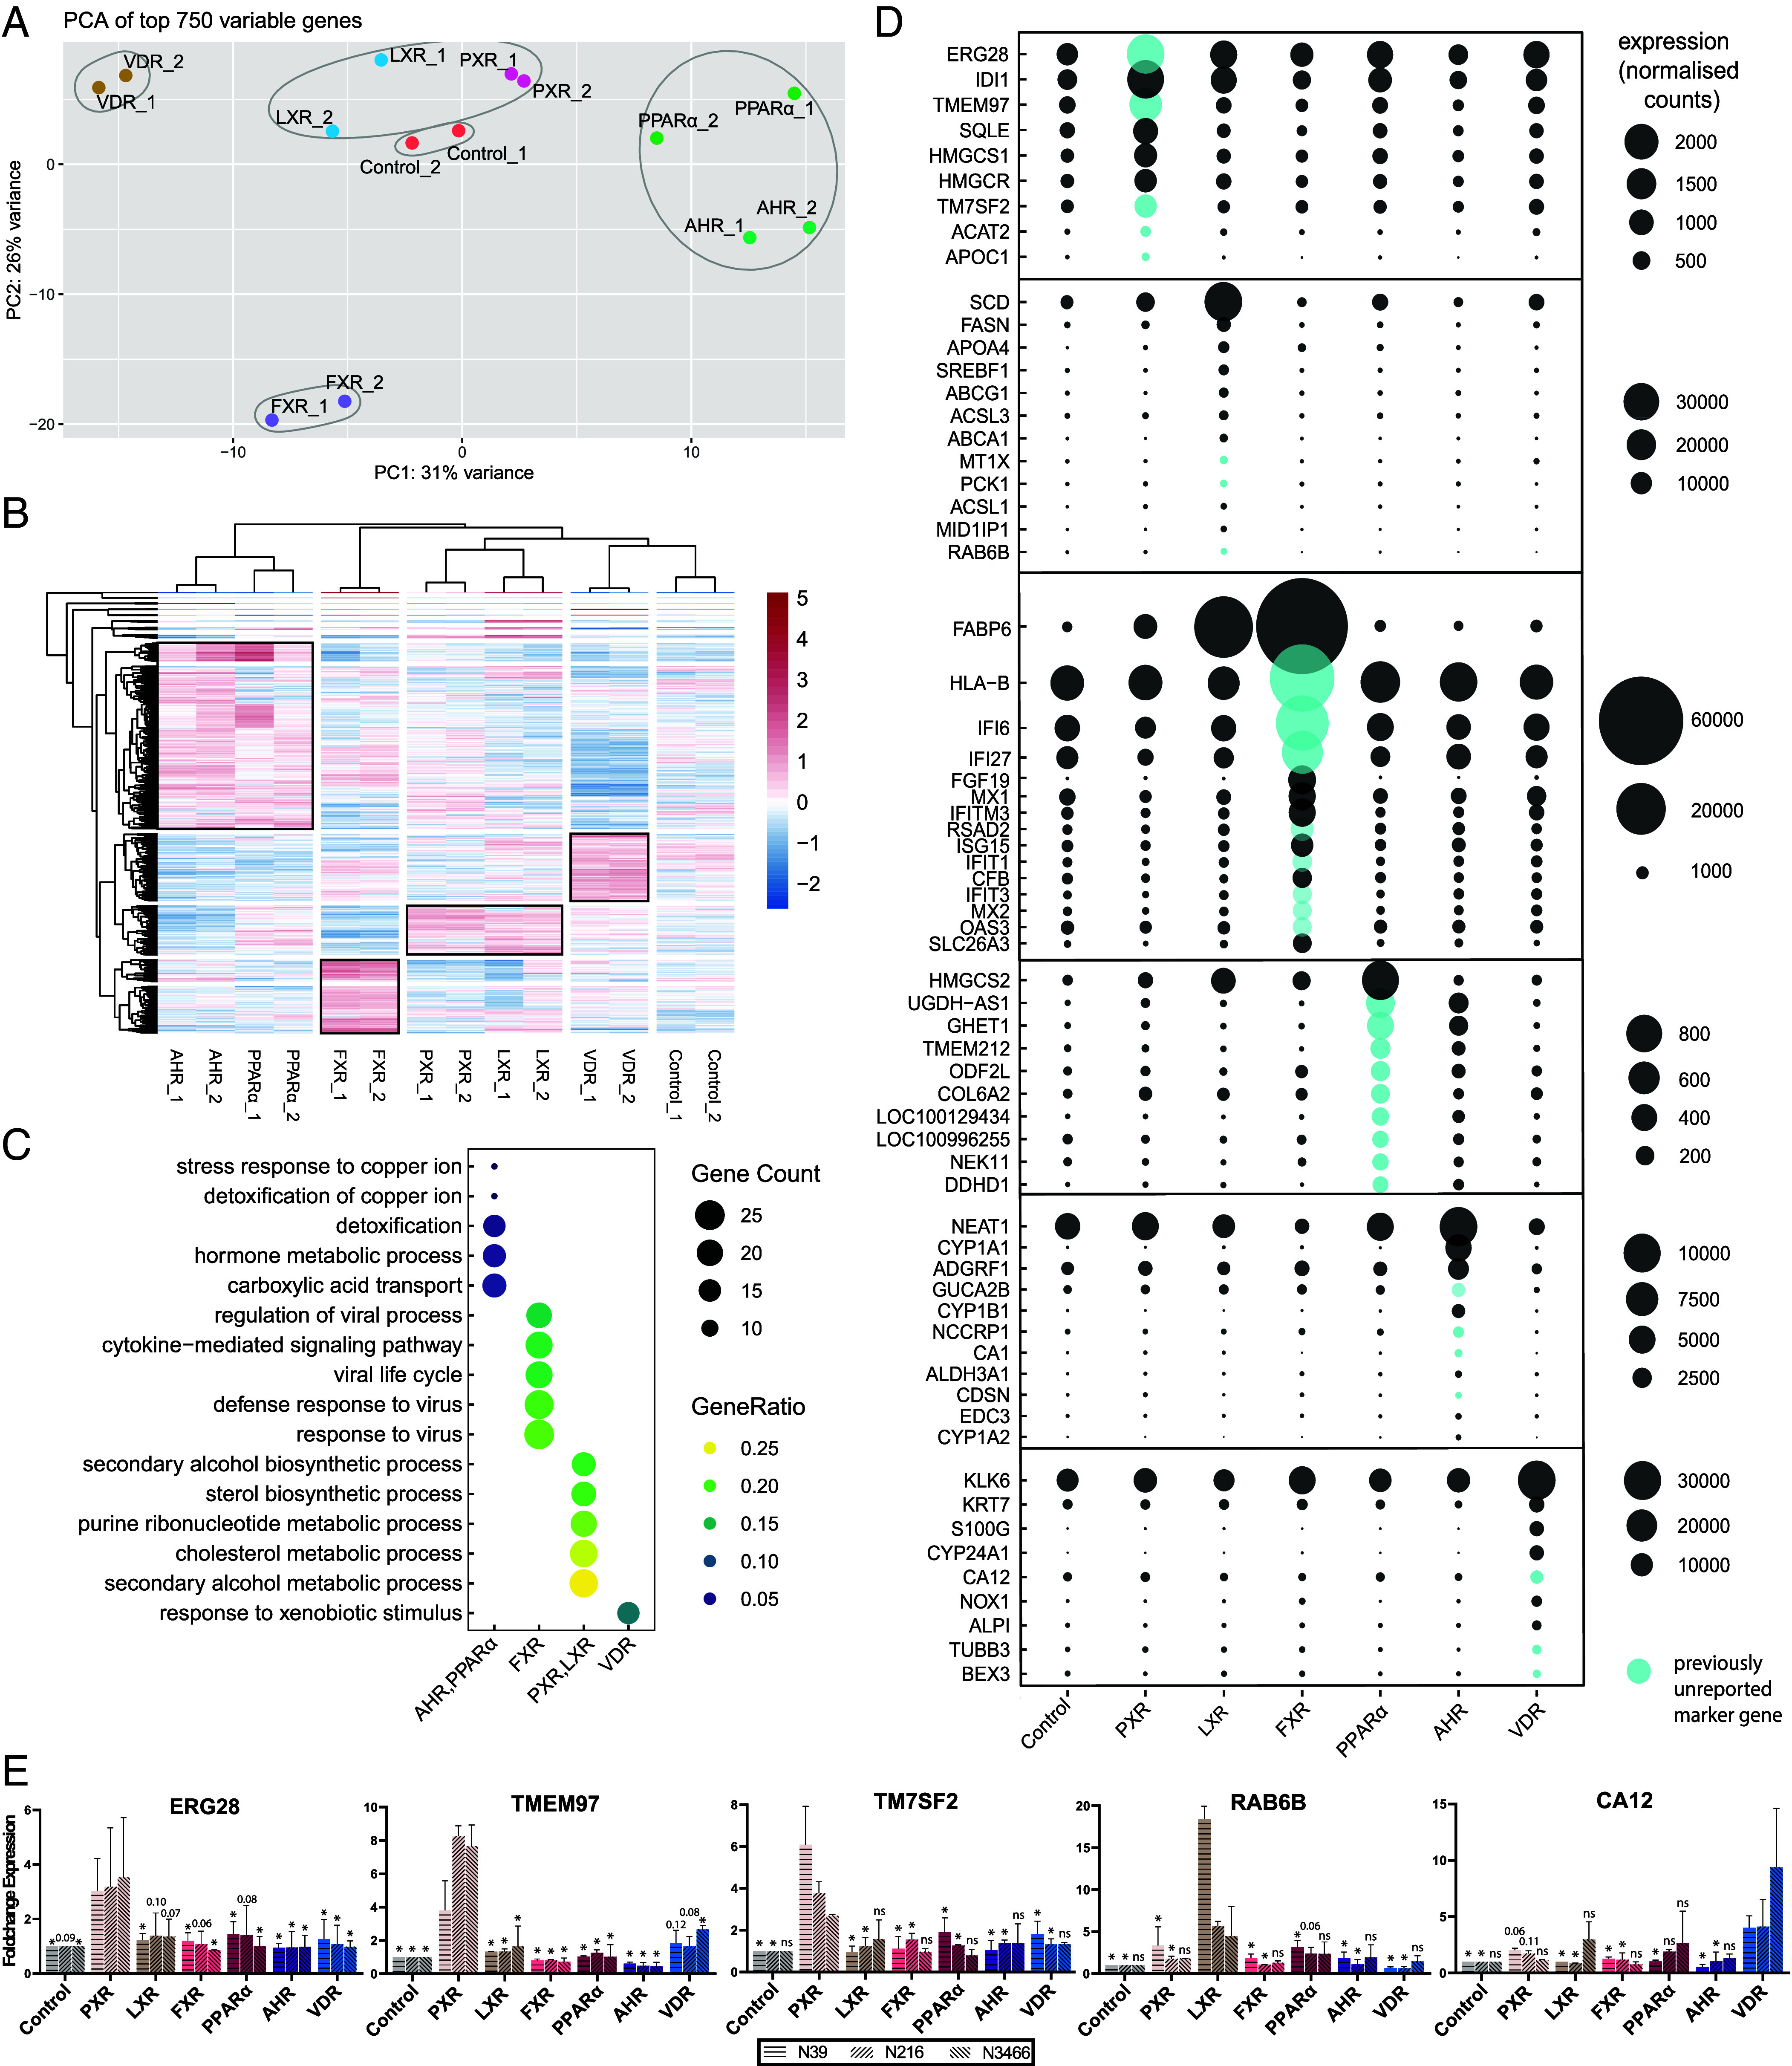
Fig. 4.

Comparison of individual nuclear receptor characterizations reveal similarities and= unique marker genes. (A) PCA of the top 750 variable genes. Number of k-means clusters were determined with the elbow method. (B) Clustered heatmap of the top 750 variable genes. Highlighted groups by row show clusters of upregulated genes that characterize the groups of NRs. (C) Enriched GO processes for each highlighted group of gene in B. (D) Putative marker genes for activation of NRs were determined among differentially expressed genes from all NR conditions. Genes that were expressed at least twofold higher in a specific NR compared to all others were considered putative marker genes. Previously unreported marker genes are marked in blue. Expression in normalized counts. (E) Unique NR marker genes resulting from qPCR validation of the three highest expressed putative marker genes for each NR condition. n = 2 with three donors. Tested with one-way ANOVA compared to the condition of the marker gene for each donor. Error bars = SD, *P < 0.05.
