
Fig. 3.
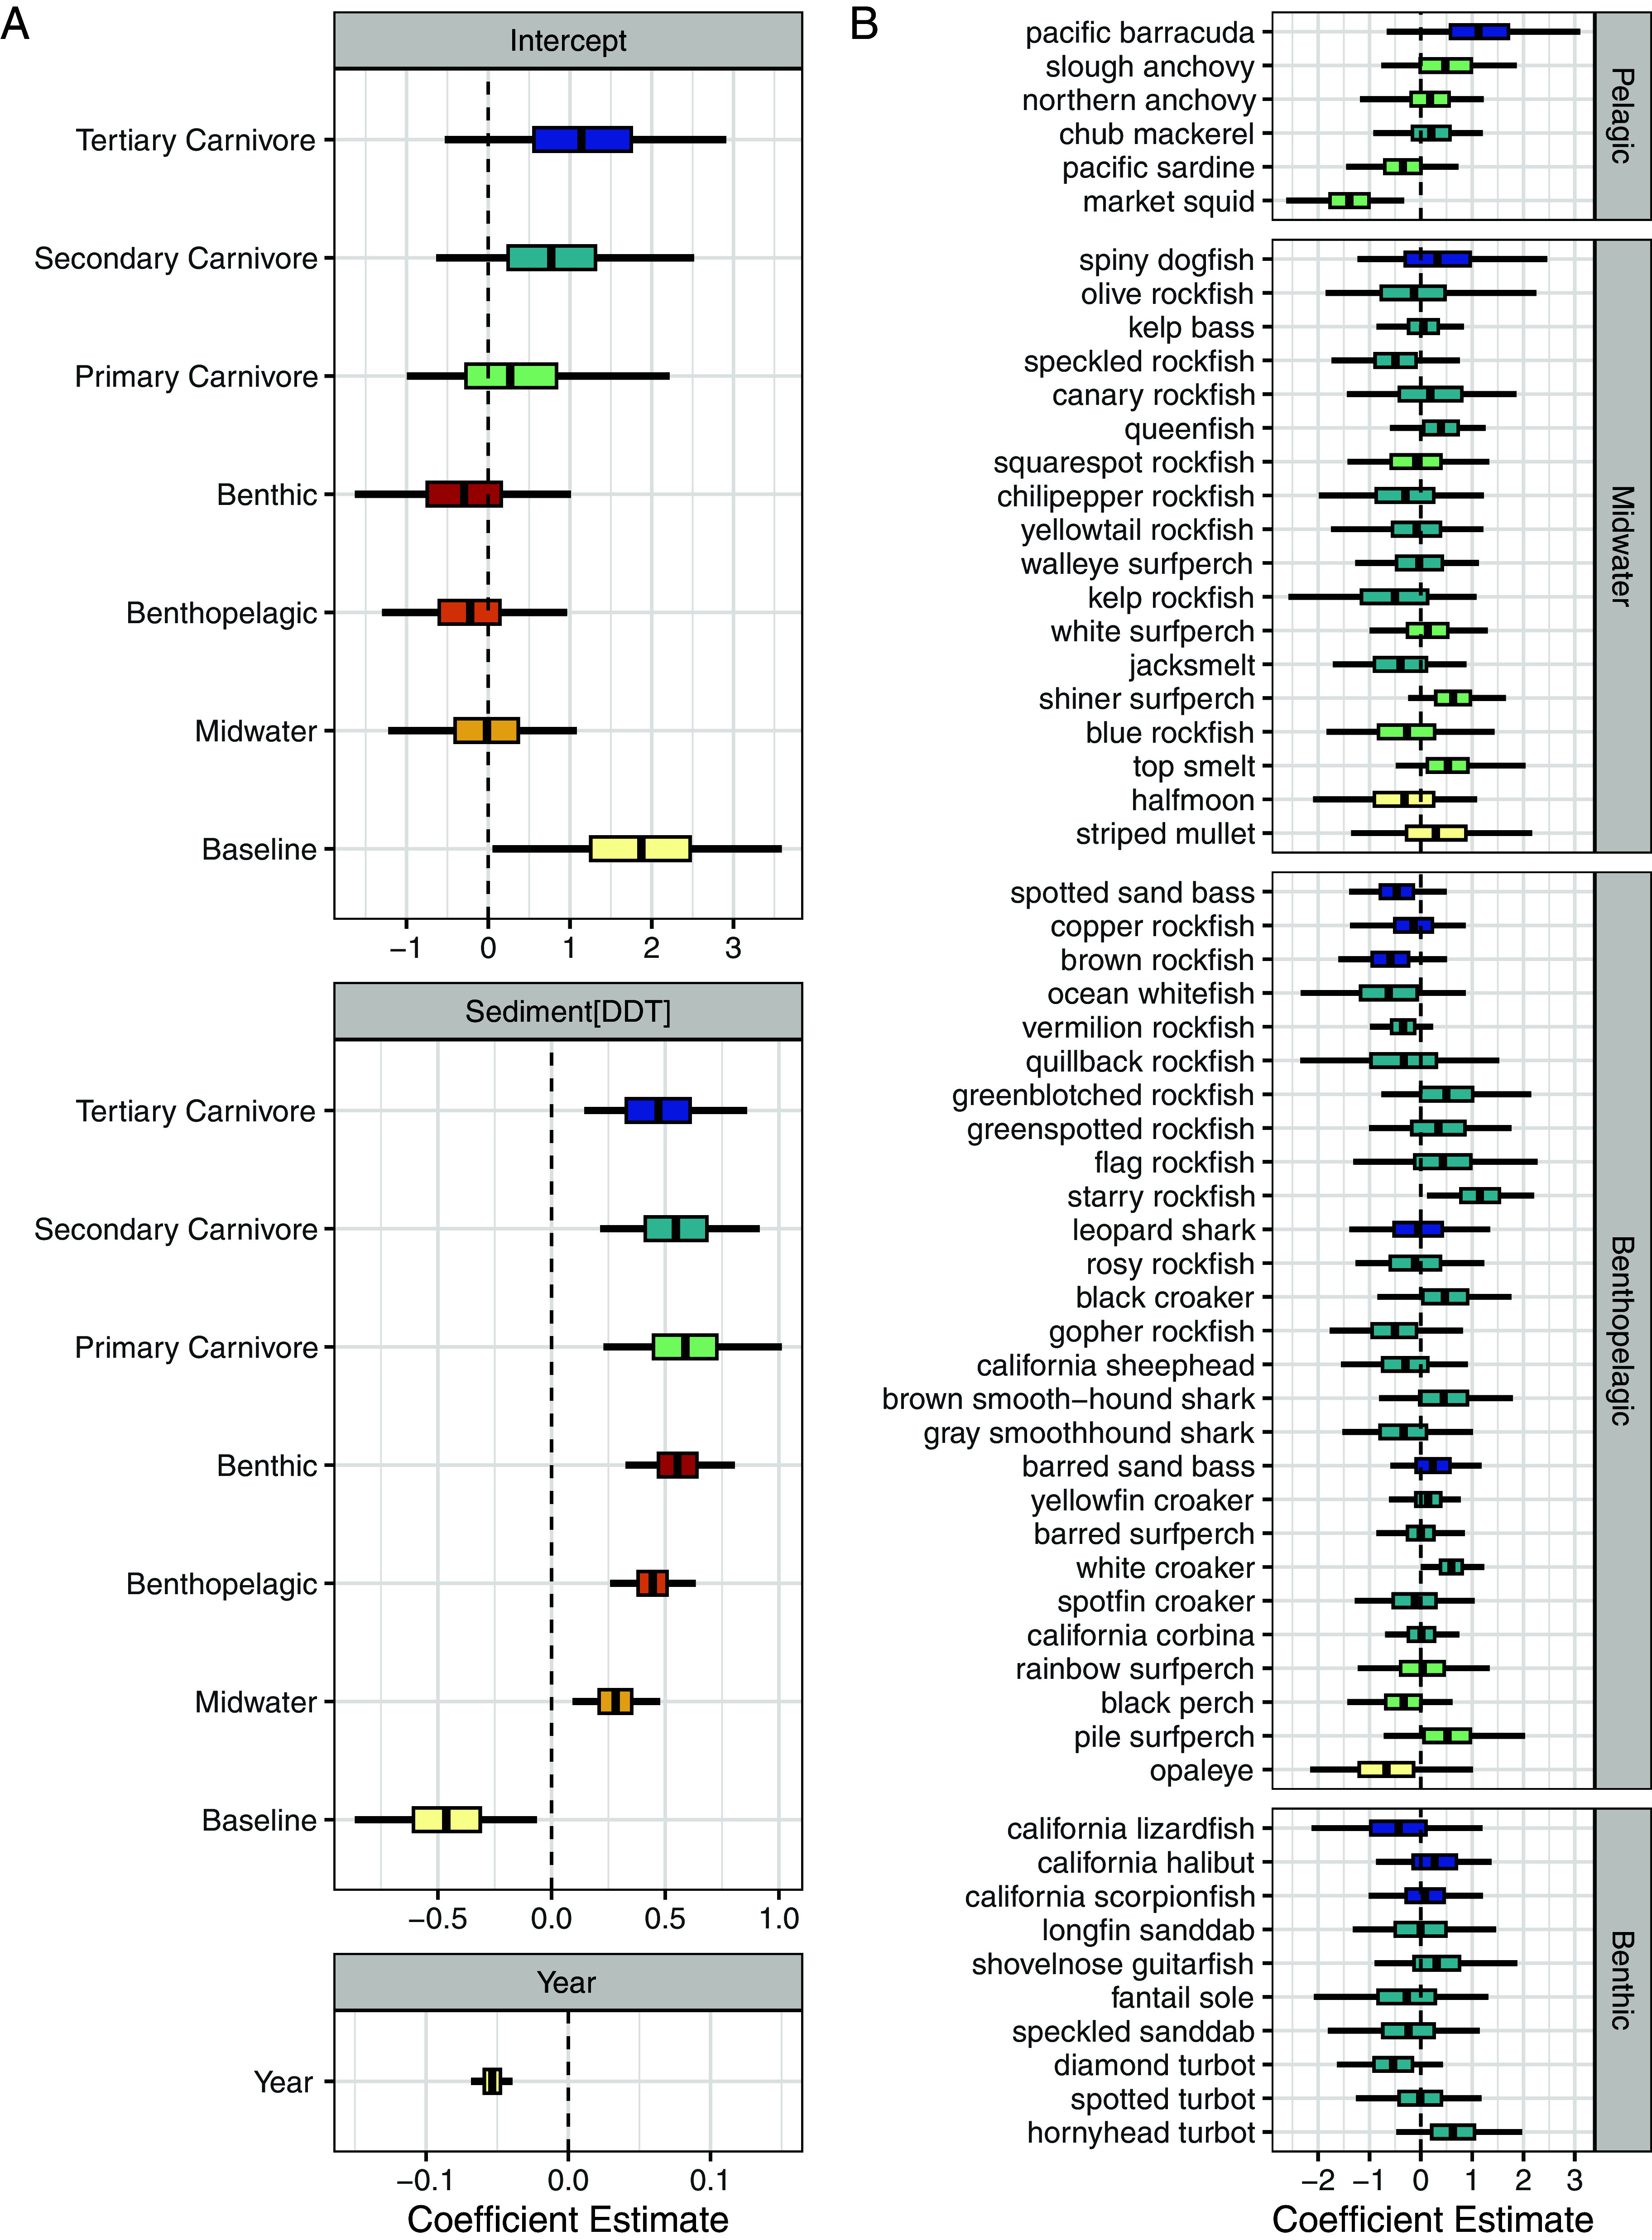
Model estimated posterior distributions for fixed (A) and random (B) effects from the diet-habitat-species-year model (Table 1). The reference category is herbivore and pelagic. Center lines are the mean estimated parameter, colored boxes represent the 80% credible interval, and the black lines are the maximum and minimum for each parameter distribution. Random effects (B) can be thought of as deviations from the group means. Color indicates diet categorization, with darker colors indicating higher trophic levels, and horizontal breaks denote habitat classification. Within each habitat category, species are arranged by the estimated FishBase trophic level.