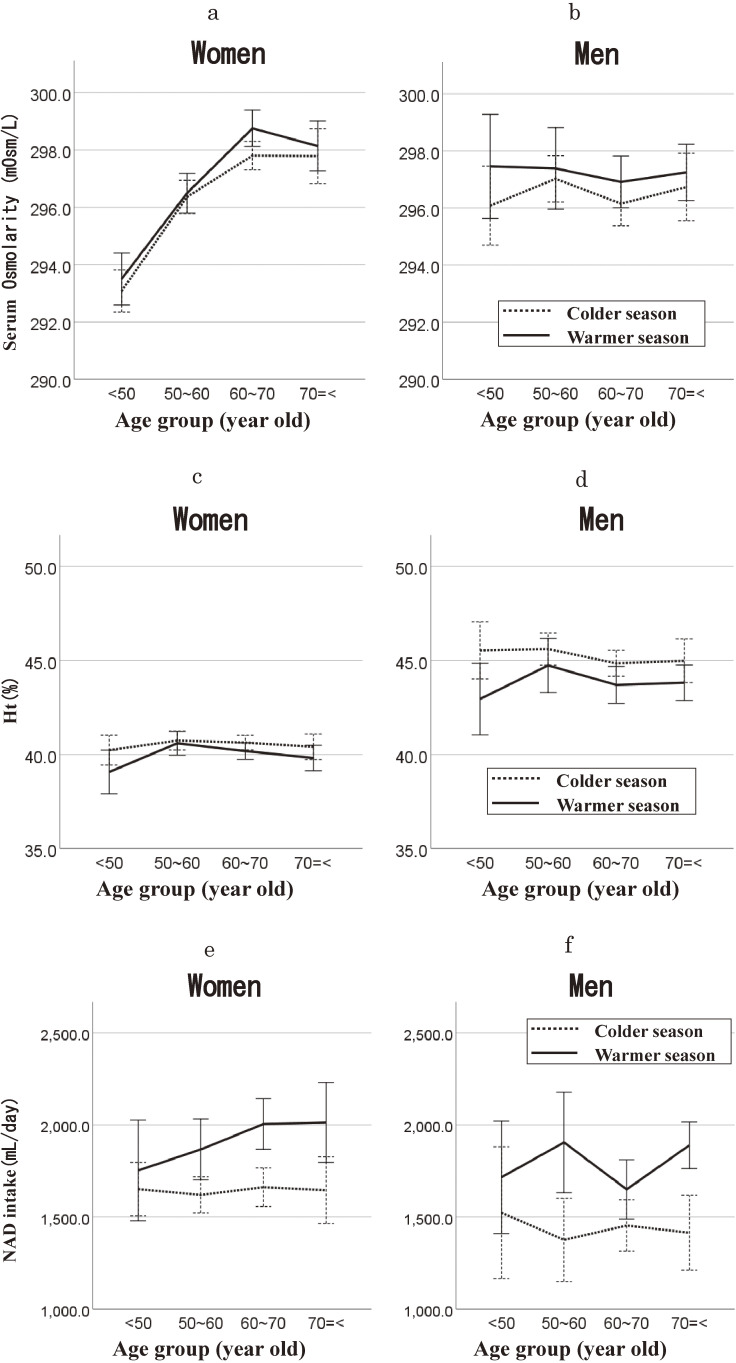
Fig. 1.
Seasonal differences in serum osmolarity, hematocrit, and non-alcohol drink intake, stratified by age group. The warmer season; from May to October, and the colder season; from November to April. The solid line represents the warmer season, and the dashed line represents the colder season. Mean serum osmolarity with error bars (95% confidence intervals) in women (a) and in men (b). Mean hematocrit with error bars (95% confidence intervals) in women (c) and in men (d). Mean non-alcohol drink intake (mL/day) with error bars (95% confidence intervals) in women (e) and in men (f).

