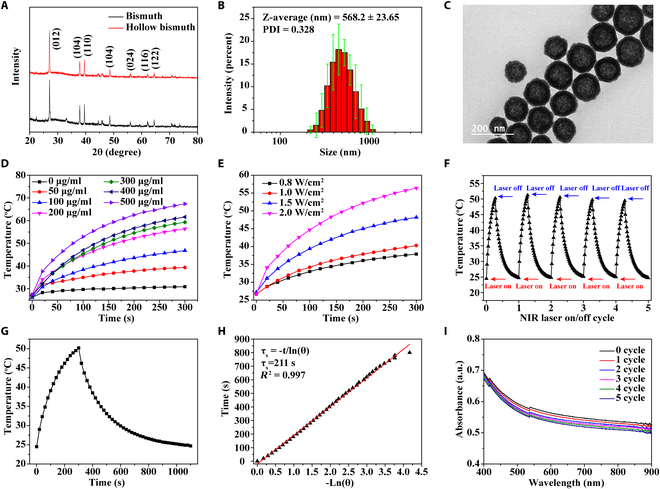
Fig. 1.

Structure and in vitro photothermal ability of the hollow Bi. (A) XRD patterns of Bi and hollow Bi. (B) Diameter dispersion of hollow Bi in deionized water measured by DLS. (C) TEM image of the hollow Bi. (D) Heating curves of hollow Bi with different mass concentrations (0, 50, 100, 200, 300, 400, and 500 μg/ml) irradiated with 808-nm NIR laser for 5 min at a power density of 2.0 W/cm2. (E) Heating curves of hollow Bi at 200 μg/ml irradiated with 808-nm NIR laser at different power densities (0.8, 1.0, and 1.5 to 2.0 W/cm2) for 5 min. (F) On–off cycling heating curves of hollow Bi at 200 μg/ml irradiated with 808-nm NIR laser (1.5 W/cm2) for 5 min on each cycle. (G) Single on–off heating curve of hollow Bi at 200 μg/ml irradiated with 808-nm NIR laser (1.5 W/cm2) for 5 min. (H) Time constant for heat transfer from the system is determined to be τs = 211 s by applying the linear time data from the cooling period (after 300 s) versus the negative natural logarithm of the driving force temperature, which is obtained from the cooling stage of (G). (I) UV–Vis spectra of hollow Bi (200 μg/ml) after irradiating for 5 cycles.
