
Fig. 4.
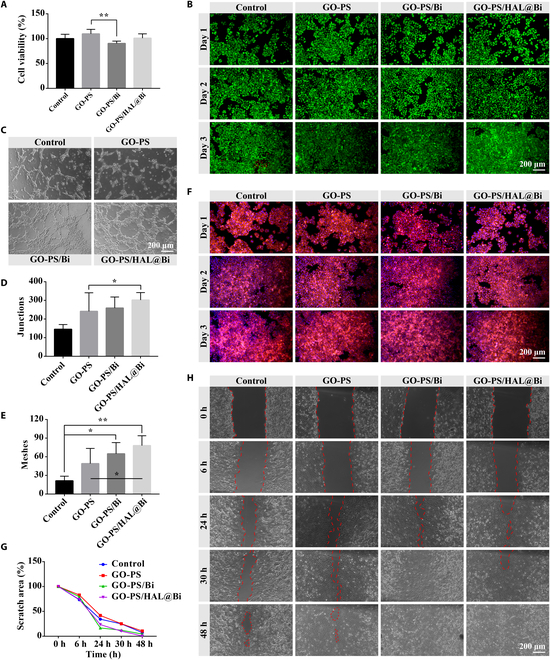
Evaluation of the effect of GO-PS/HAL@Bi hydrogel on HUVECs. (A) Cell viability of HUVECs treated with hydrogel extract for 24 h detected by the CCK-8 method (n = 4, *P < 0.05, **P < 0.01). (B) Live/dead staining of HUVECS treated with hydrogel extract for 24 h. (C) Images of in vitro tube formation of HUVECs. (D) Junctions and (E) meshes formed in the tube networks (n = 4, *P < 0.05, **P < 0.01). (F) Cytoskeleton staining of HUVECS treated with hydrogel extract for 24 h. (G) Statistical values and (H) images of scratch area (n = 4).