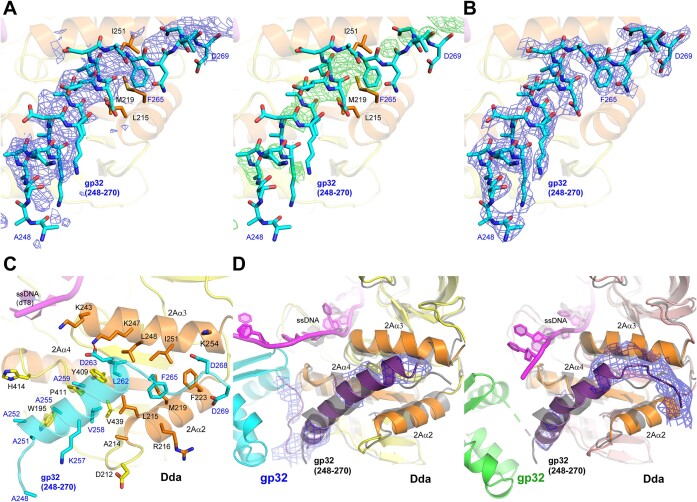
Figure 4.
The C-terminal region of gp32 bound to Dda. (A) The initial unbiased electron density maps of the bound peptide in the gp32 C-terminal peptide/Dda/dT8 complex. The 2Fo-Fc electron density is shown as a blue mesh contoured at 1σ (left) and the Fo-Fc electron density is shown as a green mesh contoured at 2σ (right). (B) The final refined 2Fo-Fc electron density map of the bound peptide, which is superimposed (cyan carbon sticks). The electron density is shown as a blue mesh contoured at 1σ. The final structure of the peptide is also shown in (A) to demonstrate the quality of the initial maps. (C) The C-terminal region of gp32 bound to Dda as revealed in the final refined crystal structure of the gp32 C-terminal peptide/Dda/dT8 complex. The bound peptide and the carbon atoms of the interacting residues are cyan, and the interacting Dda secondary structures 2Aα2, 2Aα3, 2Aα4 and 2Aβ5 and the carbon atoms of the interacting residues are orange. (D) The C-termini in the final refined crystal structure of the gp32–Dda–dT17 complex. There are two independent interactions with Dda in the dimeric complex, and both are very similar. The orientations are identical and match that shown in Figure 1B. The 2Fo-Fc electron densities of the gp32 C-termini are unbiased and were calculated without the fitted C-termini in the gp32-Dda-dT17 complex; they are shown as blue mesh contoured at 1σ. The superimposed structure of the gp32 C-terminal peptide/Dda/dT8 complex (gray color) is shown in gray. In (C) and (D), the coloring of the proteins and ssDNA match that shown in Figure 1, and the interacting Dda secondary structures 2Aα2, 2Aα3, 2Aα4 and 2Aβ5 are highlighted in orange.

