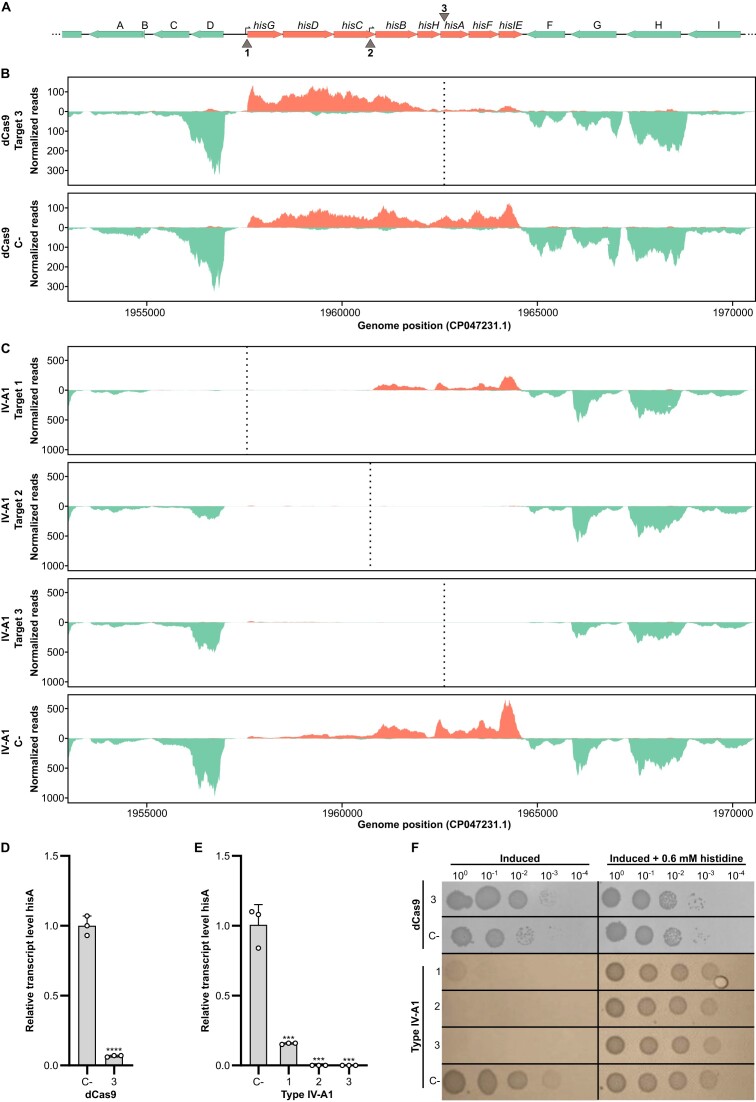
Figure 2.
Interference of the recombinant Type IV-A1 CRISPR–Cas system on the histidine operon. (A) Schematic representation of a 17 kb region of E. coli Bl21-AI genome containing the histidine operon. Genes are represented as horizontal arrows indicating the direction of transcription. Green arrows represent genes outside of the histidine operon, and salmon arrows represent genes that are part of the histidine operon. Gene A: plaP; gene B: yoeI; gene C: GSU80_09680; gene D: GSU80_09685; gene F: wzzB; gene G: GSU80_09740; gene H: gndA; and gene I: opsG. Vertical arrows (1–3) indicate three target sites, targeting the coding or non-coding strand, respectively. 1: target in the histidine operon promoter; 2: target in the internal promoter in hisC; and 3: target in hisA. (B) Illumina RNA-seq coverage plots of the histidine operon region with dCas9 targeting hisA gene (3). The plots indicate a reduction in the number of reads in the local area of the target in comparison to the negative control (dCas9 C-). (C) Illumina RNA-seq coverage plots of the histidine operon region with different sites targeted by the Type IV-A1 CRISPR–Cas system. The plots indicate a significant reduction in the number of reads for the different treatments in comparison to the negative control (IV-A1 C-). (D) RT-qPCR of hisA targeted by dCas9 (3). (E) RT-qPCR of hisA with different Type IV-A1 target sites on the histidine operon. Statistical analysis was performed using an unpaired two-tailed t-test. Data represent the mean (± SD) of n = 3 biological replicates, with ***P ≤ 0.0005 and ****P < 0.0001. (F) Spotting assay after CRISPRi with different sites targeted by dCas9 or Type IV-A1. Cells were plated in 10-fold dilution series (3 μl of each dilution) onto two plates made of M9 minimal medium with or without 0.06 mM histidine, respectively, both containing inducers [1 mM IPTG and 0.2% (w/v) arabinose].

