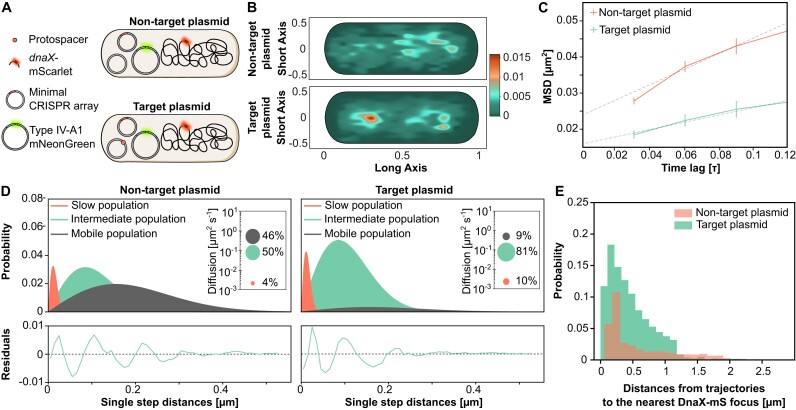
Figure 5.
Spatiotemporal dynamics of DnaX-mS with and without Type IV-A1 crRNPs targeting plasmids. (A) Schematic of the strains used to study the dynamics of DnaX. (B) Heat maps of all tracks projected in a representative cell indicating the spatial distribution of mScarlet-tagged DnaX (DnaX-mS) in E. coli BL21-AI described in panel (A). The yellow-reddish areas indicate the highest probability of distribution tracks with longer scanning time. (C) MSD analysis of DnaX-mS molecules in cells expressing mNeonGreen-tagged crRNPs with and without plasmid target. Shown is a comparison of the MSD values obtained at different time intervals in the two conditions. The data points represent the mean MSD, with error bars indicating the standard error of the mean. (D) Jump-distance distribution histograms of the DnaX-mS molecules in the two indicated conditions were calculated as described in Figure 3E. (E) Histogram showing the probability distribution of distance measurements between mNeonGreen-tagged crRNP complex tracks and the nearest DnaX focus, representing dwelling events. Green bars indicate Type IV-A1-mNeonGreen tracks in the presence of a target plasmid. Salmon bars represent the Type IV-A1-mNeonGreen tracks in the presence of a non-target plasmid.

