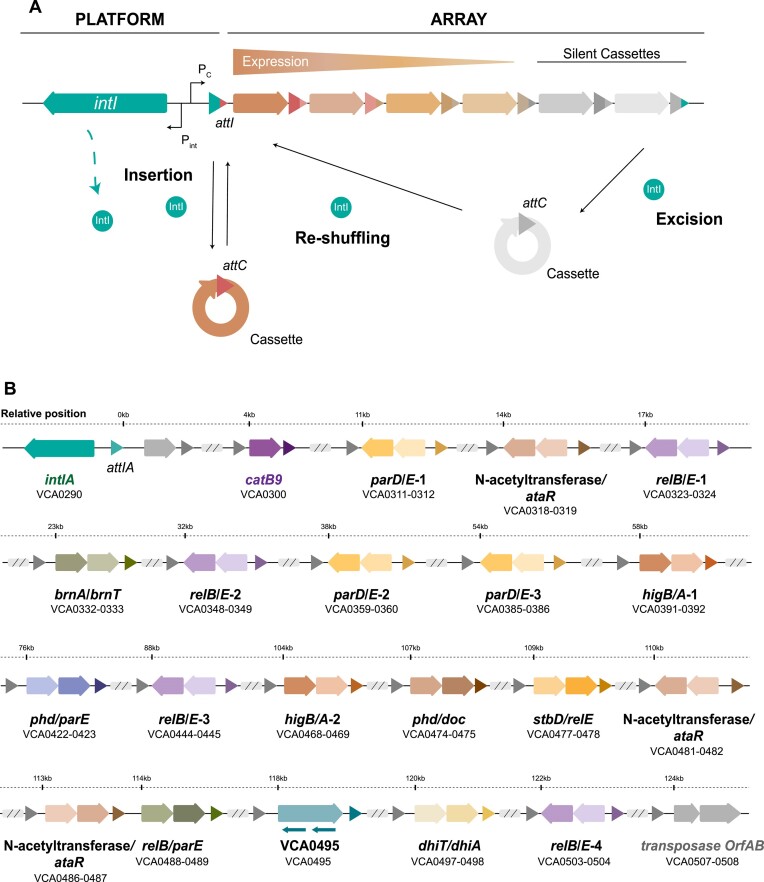
Figure 1.
(A) Schematic representation of an integron. On the left side, the functional platform includes the integrase gene (intI1), the cassette promoter (PC), the integrase promoters (Pint) and the integron insertion site (attI). On the right side, the variable array of ICs is shown. Hybrid attI and attC sites are marked with corresponding colors. The arrows within the cassettes indicate the orientation of the open reading frame, with the color intensity of each arrow representing the expression level. The diagram also illustrates the primary reactions mediated by the IntI recombinase: cassette insertion (attI × attC), excision (attC × attC) and reshuffling. (B) Diagram showing the organization and relative position of the relevant genes within the SI cassette array. Arrows represent individual genes contained within cassettes, while gray triangles denote the attC sites. TA systems are illustrated with colored arrows: darker arrows indicate toxins and lighter arrows indicate antitoxins. The orientation and position of each arrow reflect the transcriptional direction of the genes. Additionally, smaller arrows mark regions corresponding to non-coding RNAs.

