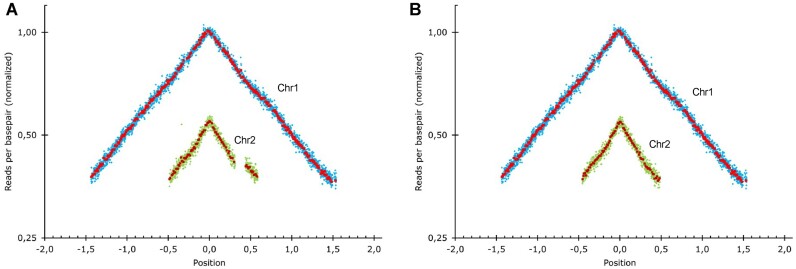
Figure 4.
Marker frequency analysis of the two chromosomes of V. cholerae ΔSI mapped against V. cholerae WT genome (A) and against V. cholerae ΔSI genome (B). The gap on chromosome 2 in panel (A) reflects the SIs deletion. The genome position is represented relative to the oriC (set to 0). Blue and green rhombus represent the average of 1 kbp windows, and red and garnet squares the average of 10 kbp windows in Chr1 and Chr 2, respectively.

