
FIGURE 3.
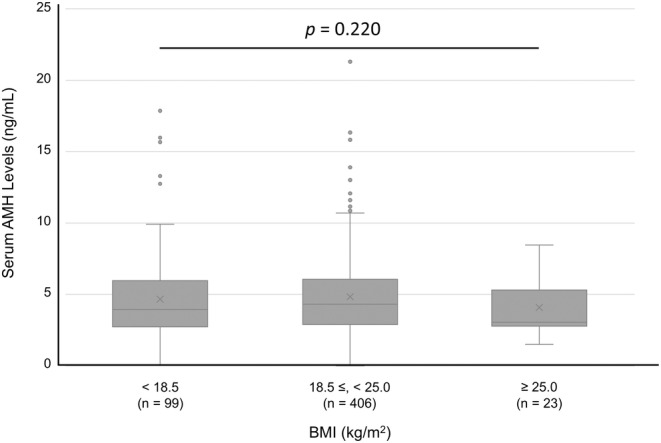
Serum AMH levels for each group classified by BMI. Variables are presented as the mean ± SD. The Kruskal–Wallis test was applied. AMH, Anti‐Müllerian hormone; BMI, Body mass index; SD, Standard deviation; n. s., Not significant.
Official websites use .gov
A
.gov website belongs to an official
government organization in the United States.
Secure .gov websites use HTTPS
A lock (
) or https:// means you've safely
connected to the .gov website. Share sensitive
information only on official, secure websites.
Serum AMH levels for each group classified by BMI. Variables are presented as the mean ± SD. The Kruskal–Wallis test was applied. AMH, Anti‐Müllerian hormone; BMI, Body mass index; SD, Standard deviation; n. s., Not significant.