
FIGURE 5.
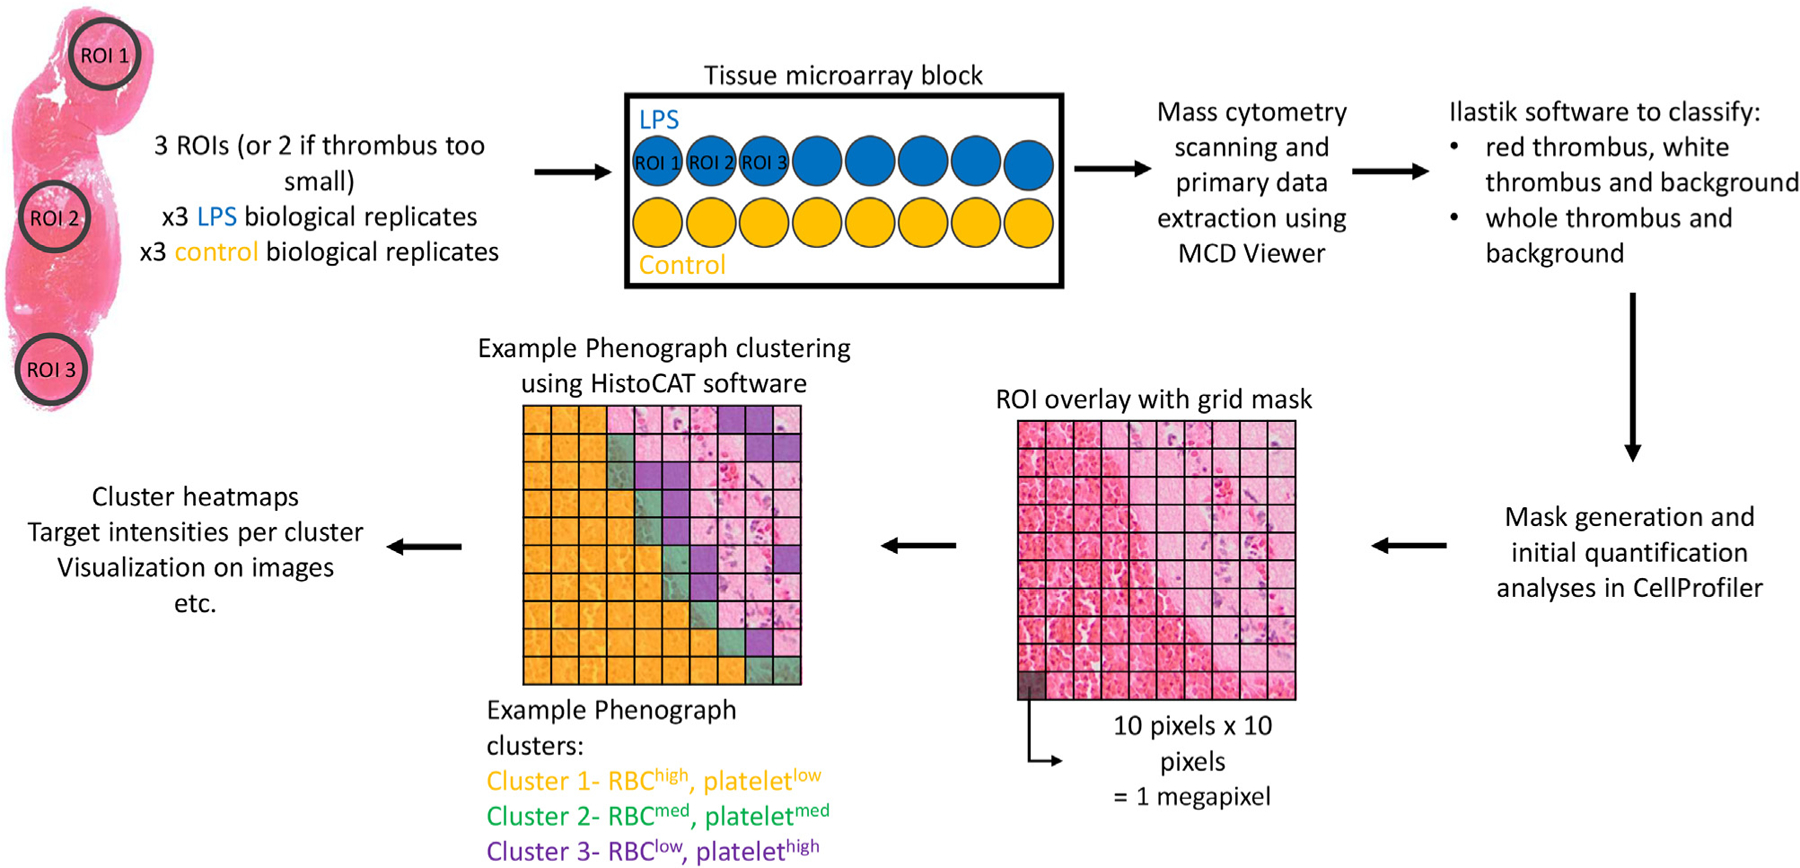
Imaging mass cytometry data analysis pipeline. Two or 3 ROIs from 3 biological replicates of thrombi from control and LPS-treated mice were stained for mass cytometry imaging. Data analysis workflow using various software is shown above. LPS, lipopolysaccharide; ROI, regions of interest.