Fig. 7.
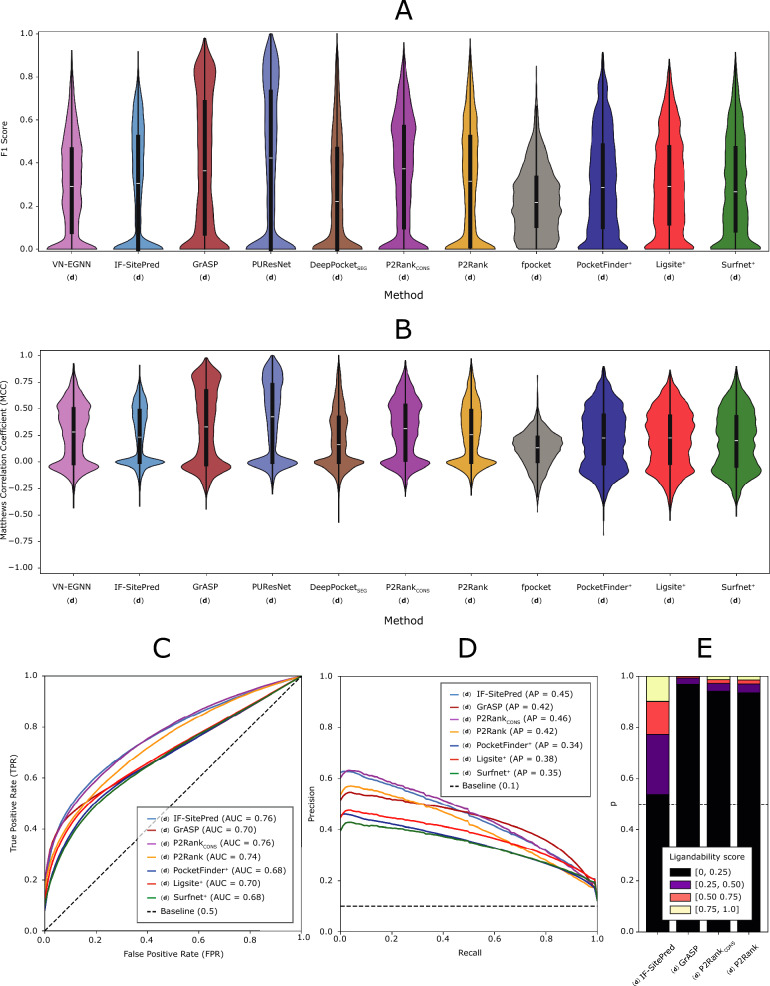
Ligand binding site prediction benchmark at the residue level. DeepPocketRESC predictions are not included in the F1 and MCC analyses as these are re-scored and re-ranked fpocket predictions and the results would be the same as fpocket’s. A F1 score distributions; B MCC distributions. In both panels, each data point in the distribution corresponds to the score obtained from all residues in a protein chain; C mean ROC curve for methods that report a residue score. Dashed line represents the baseline, 1 FP for each TP, i.e., diagonal and AUC = 0.5; D mean PR curve. Dashed line represents the baseline, i.e., proportion of observed binding residues = 0.1; Mean ROC and PR curves are calculated by averaging the curves of the 2775 LIGYSIS protein chains. E Distribution of residue ligandability scores for IF-SitePred, GrASP and P2Ranks. PocketFinder+, Ligsite+ and Surfnet+ are not included as their scores do not range 0–1, and a small number of scores can reach values > 25. (d) indicates that these predictions originate from the original methods run with default parameters

