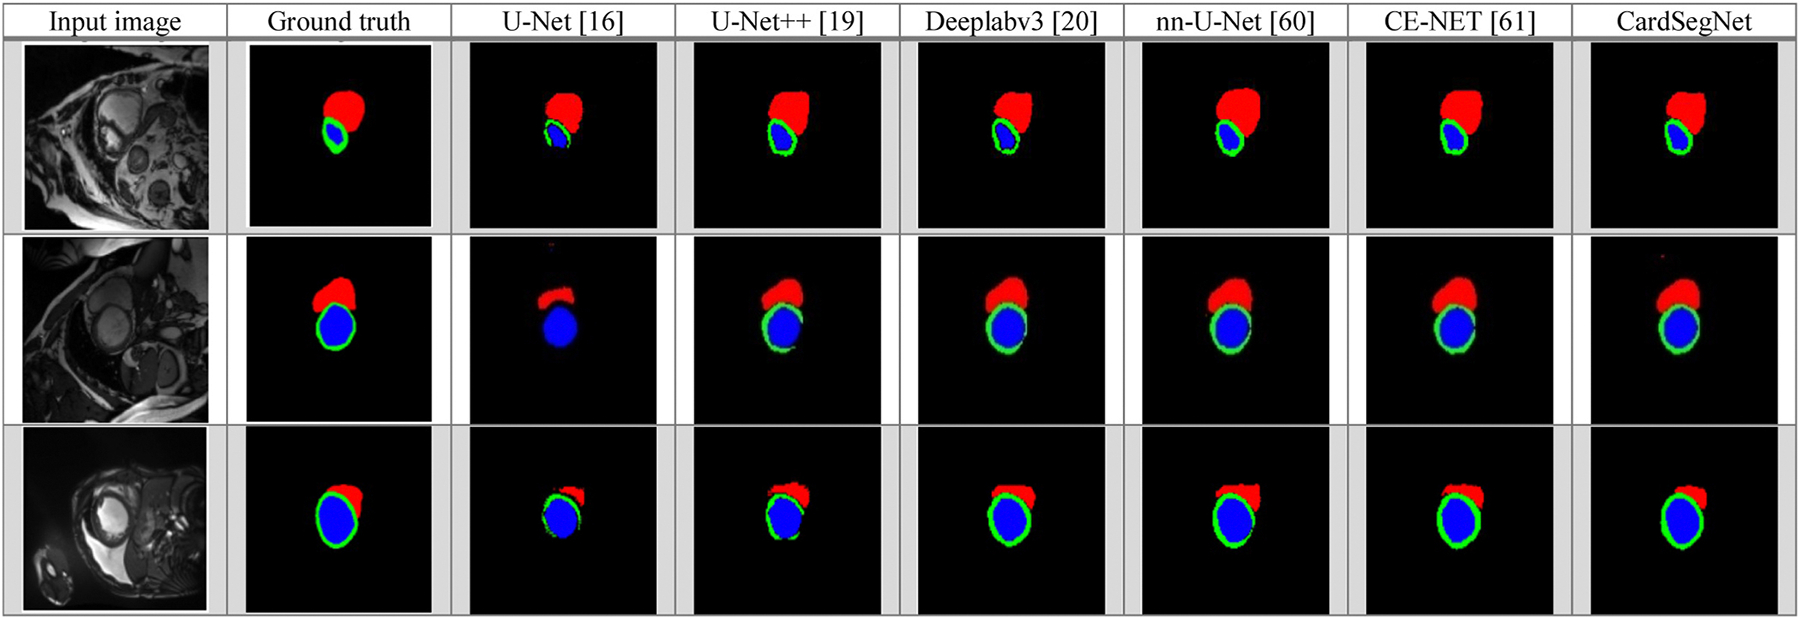
Fig. 8.

Comparison of different DL method segmentation results: visualization using five baseline models (U-Net, U-Net++, Deeplabv3, nnU-Net, CE-Net) and CardSegNet over a sample subset of ACDC2017 test dataset. Red, green, and blue regions are the right ventricle (RV), myocardium, and left ventricle (LV) areas, respectively.
