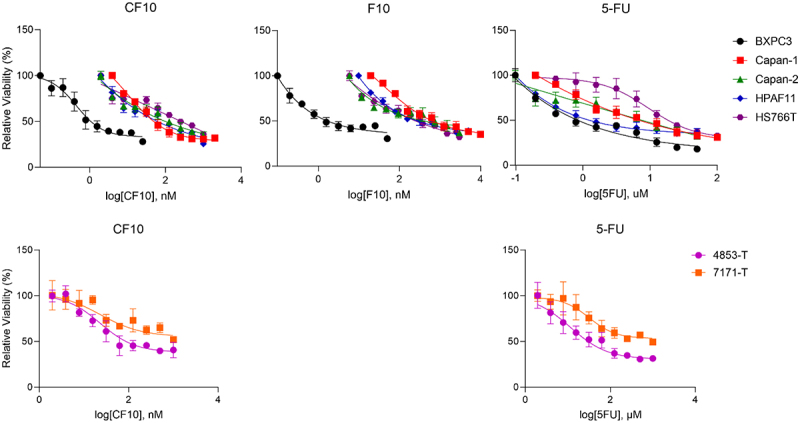
Figure 2.

Dose-response viability curves for CF10, F10 and 5-FU in five conventional PDAC (BXPC-3, Capan1, Capan2, HPAF11, HS766T) and two primary patient-derived (7171-T and 4853-T) cell lines showing single agent efficacy. CF10 and F10 are displayed in nM while 5-FU is displayed in µm. IC50 values were calculated and reported in Table 1.
