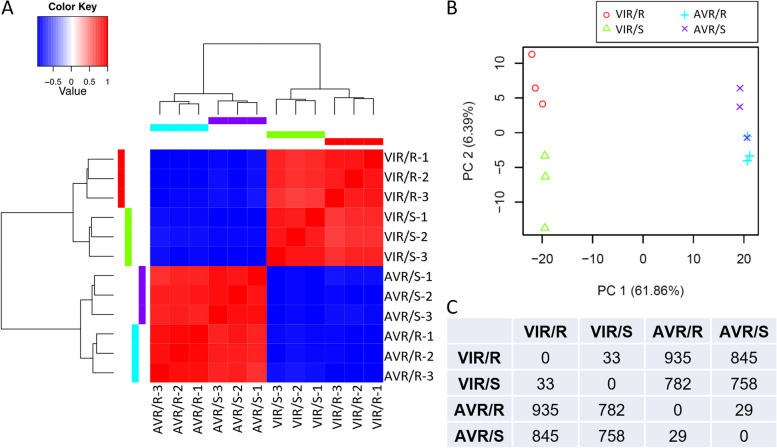
Fig. 3.
Transcriptome analysis of aphid heads. Samples were dissected heads from AVR (PS01) and VIR (N116) genotypes infested on resistant (R; A17) or susceptible (S; DZA315.16) Medicago truncatula genotypes for 24 h, with n = 3 biological replicates. Aphid genotype PS01 displays an incompatible interaction on M. truncatula A17, and all other combinations represent compatible interactions. A Transcriptional profile heat map of log2-zero centred TMM-FPKM values for all differentially expressed genes, showing samples clustered more strongly based on aphid genotype than on host interaction; B Principal components analysis. The top two principal components explain > 68% of the variation among transcriptional responses. Samples group largely by aphid genotype rather than host interaction; C Numbers of genes differentially expressed between the different aphid genotypes on different M. truncatula genotypes. Of the 935 DE genes between AVR and VIR on the R host, 483 were up in VIR and 452 were up in AVR aphids. Of the 758 DE genes on the S host, 395 were up in VIR and 363 were up in AVR aphids. Accompanying gene lists and annotations are provided in Supplementary Material 4

