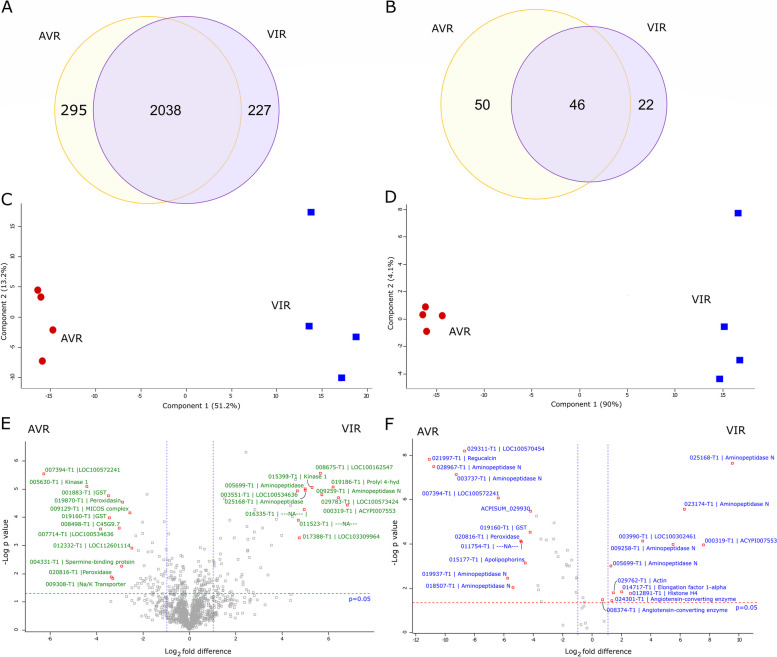
Fig. 6.
Comparative proteomic analysis of salivary glands and saliva for VIR and AVR pea aphid genotypes. Samples were from parental clones N116 (VIR) and PS01 (AVR). Venn diagrams of the number of proteins shared and found exclusively in A) salivary glands and B) saliva identified for both genotypes. Principal Components Analysis (PCA) of C) salivary glands and D) saliva distinguishes both genotypes clearly. Volcano plots based on -log10P values and log2 fold differences highlighting the statistically significant differentially abundant (SSDA) proteins (P ≤ 0.05) for E) salivary glands and F) saliva. Annotations are shown for the top 12 proteins of increased and decreased abundances

