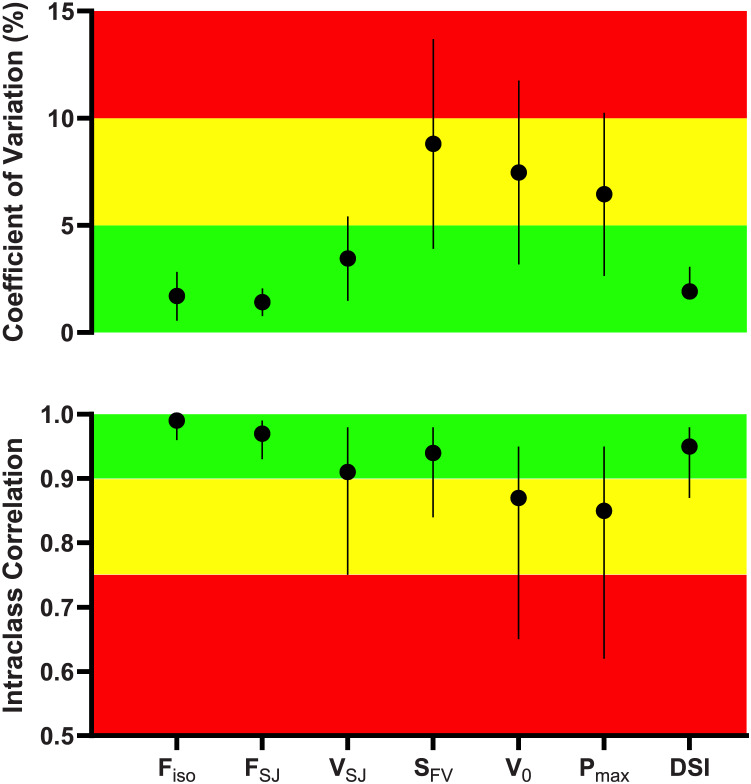
Figure 2. Intrasession reliability of force-velocity-power variables obtained during the isometric mid-thigh pull and squat jump testing.
Data are presented as mean with a 95% confidence interval (CI, vertical lines) of the coefficient of variations (upper panel) interpreted as good (<5%, green), moderate (5% to 10%, yellow), and poor (>10%, red), while the intraclass correlation coefficients with 95% CI were interpreted as moderate (0.50-0.749), good (0.75-0.90), and excellent (>0.90).

