. 2024 Nov 7;12(11):e010145. doi: 10.1136/jitc-2024-010145

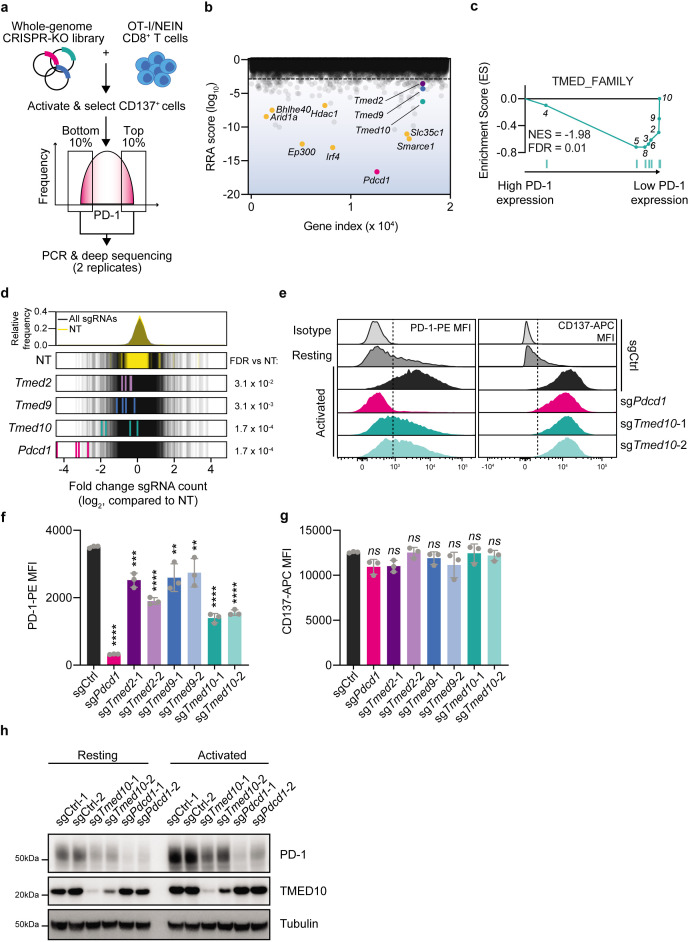
Figure 1. Whole-genome dual marker FACS-based CRISPR-Cas9 screen in primary murine CD8 T cells identifies TMED proteins as regulators of PD-1 abundance. (a) Schematic representation of the dual-marker FACS-based CRISPR-Cas9 screen for PD-1 regulators. (b) RRA score (log10) for each of the genes in the PD-1 regulator screen comparing the PD-1High to the PD-1Low populations. The gene index value refers to the numerical position of a given gene in an alphabetized list of all targeted genes. Statistics were performed by MAGeCK (V0.5.7).63 (c) Gene set enrichment analysis plot of the TMED_FAMILY gene set, comprising all known TMED protein family members, using the RRA score from (b) as a ranking metric. The numbers refer to the position of each individual TMED family member. (d) Log2-fold change of individual sgRNAs compared with all sgRNAs. Each of the guides targeting a particular gene is highlighted, with its values being normalized to the non-targeting sgRNA distribution. Statistics were performed by MAGeCK (V.0.5.7).63 The dotted red line indicates a twofold change. (e) Representative flow cytometry histograms for the abundance of PD-1-PE (left) and CD137-APC in OT-I/Cas9 CD8 T cells of the indicated genotypes and activation status. The dotted line indicates the level of the background signal. (f) Quantification of the experiment in (d) for PD-1-PE MFI of activated cells. Each data point indicates data obtained with CD8 T cells from an independent spleen. Error bars denote SD. Statistics were performed with a one-way analysis of variance, followed by a Dunnett post hoc test, comparing the MFI of each of the populations to that of the non-targeting control sgRNA condition. (g) As in (e) but for CD137-APC MFI. (h) Western blot analysis of PD-1 and TMED10 abundance in OT-I/Cas9 CD8 T cells carrying the indicated sgRNA before or after activation with CD3 antibody for 24 hours. The size markings indicate the size of the closest molecular weight marker. *p<0.05; **p<0.01; ***p<0.001; ****p<0.0001. FACS, fluorescence activated cell sorting; MFI, mean fluorescence intensity; PD-1, programmed cell death protein-1.

Figure 1